|
1 2 3 4 5 6 7 8 9 10 11 12 13 14 15 16 17 18 19 |
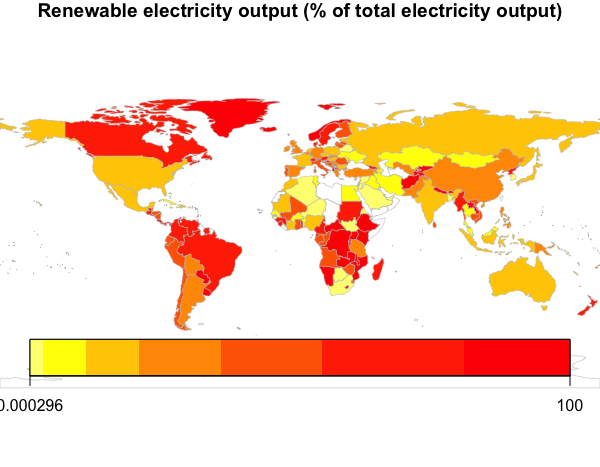
# ---------------- library(rworldmap) options("scipen"=100, "digits"=4) year <- 2015 target.year <- which(renewable.electricity.output$year==year) head(renewable.electricity.output[target.year,]) renewable.electricity.output.year <- na.omit(renewable.electricity.output[target.year,]) renewable.electricity.output.year <- renewable.electricity.output.year[which(renewable.electricity.output.year$EG.ELC.RNEW.ZS>0),] mapped_data <- joinCountryData2Map(renewable.electricity.output.year, joinCode = "ISO2", nameJoinColumn = "iso2c") par(mai=c(0,0,0.2,0),xaxs="i",yaxs="i") mapCountryData(mapped_data, nameColumnToPlot = "EG.ELC.RNEW.ZS",mapTitle=paste(titel,subtitel)) mapCountryData(mapped_data, nameColumnToPlot = "EG.ELC.RNEW.ZS",mapRegion="world",mapTitle=paste(titel,subtitel), numCats=2,catMethod=c(0:100),addLegend=FALSE,colourPalette=c("red","green")) |
|
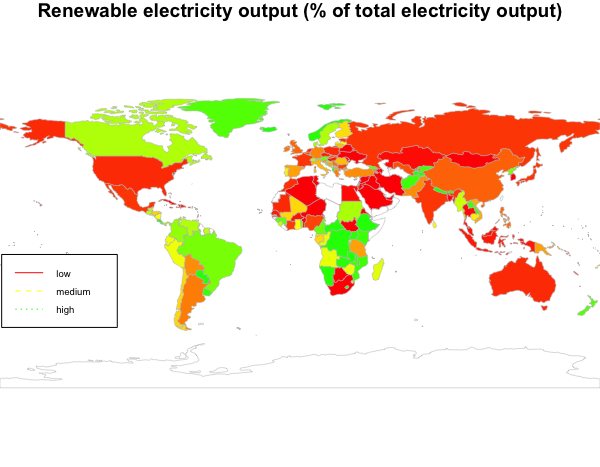
1 2 3 |
mapCountryData(mapped_data, nameColumnToPlot = "EG.ELC.RNEW.ZS",mapRegion="world",mapTitle=paste(titel,subtitel), numCats=3,catMethod=c(0:100),addLegend=FALSE,colourPalette=c("red","yellow","green")) legend(-179, -10, legend=c("low", "medium","high"), col=c("red", "yellow","green"), lty=1:3, cex=0.6) |