|
1 2 3 4 5 6 7 8 9 10 11 12 13 14 15 16 17 18 19 20 21 22 23 24 25 26 27 28 29 30 31 32 33 34 35 36 37 38 39 40 41 42 43 44 45 46 47 48 49 50 51 52 53 54 55 56 57 58 59 60 61 62 63 64 65 66 67 68 69 70 71 72 73 74 75 76 77 78 79 80 81 82 83 84 85 86 87 88 89 |
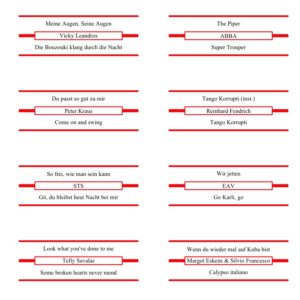
# - - - - - - - - - - - - - - - - - - - - - - - - - - - - - - - - - - - - - - - # # jukebox labels j_list <- read.csv2('Mappe1.csv', skip = 2) j_list[ 1, ] j_list[ , 1 ] length( j_list[ , 1 ] ) ceiling( length( j_list[ , 1 ] ) / 8 ) g <- 1 for( f in 1:ceiling( length( j_list[ , 1 ] ) / 8 ) ) { jpeg( paste( "jukebox_" , f, ".jpg", sep = "") , width = 800, height = 800 ) #jpeg("test2.jpg", width=800, height=800) #par( mar = rep( 1, 4 ), bg = "white") #par( mfrow = c( 1, 1 ), bg = "white") par( mfrow = c( 4, 2 ), bg = "white") print( g ) #for( e in 1:8 ){ for( e in g:(g+7) ){ plot.new() plot.window(xlim = c(0, 800), ylim = c(0, 250)) #lines(c(0, 800, 800, 0,0), c(0, 0, 250, 250,0), type = "l", lwd = 6, col = "red") # data frame with points to connect lines(c(0, 800), c(0, 0), type = "l", lwd = 6, col = "red") lines(c(0, 800), c(250, 250), type = "l", lwd = 6, col = "red") #lines(c(0, 100), c(131, 131), type = "l", lwd = 4, col = "red") #lines(c(0, 100), c(129, 130), type = "l", lwd = 4, col = "red") #lines(c(0, 100), c(129, 129), type = "l", lwd = 4, col = "red") for(i in 119:131){ lines(c(0, 100), c(i, i), type = "l", lwd = 4, col = "red") } #lines(c(700, 800), c(123, 123), type = "l", lwd = 4, col = "red") #lines(c(700, 800), c(121, 121), type = "l", lwd = 4, col = "red") #lines(c(700, 800), c(119, 119), type = "l", lwd = 4, col = "red") for(i in 119:131){ lines(c(700, 800), c(i, i), type = "l", lwd = 4, col = "red") } #lines(c(0, 100, 100, 700,700,800), c(125, 125, 150, 150,125,125), type = "l", lwd = 7, col = "red") # data frame with points to connect #lines(c(0, 100, 100, 700,700,800), c(125, 125, 100, 100,125,125), type = "l", lwd = 7, col = "red") # data frame with points to connect #lines(c(100, 100, 100, 700,700,700), c(125, 125, 150, 150,125,125), type = "l", lwd = 7, col = "black") # data frame with points to connect #lines(c(100, 100, 100, 700,700,700), c(125, 125, 100, 100,125,125), type = "l", lwd = 7, col = "black") # data frame with points to connect #lines(c(100, 100, 100, 700,700,700), c(125, 125, 150, 150,125,125), type = "l", lwd = 3, col = "red") # data frame with points to connect #lines(c(100, 100, 100, 700,700,700), c(125, 125, 100, 100,125,125), type = "l", lwd = 3, col = "red") # data frame with points to connect lines(c(105, 105, 105, 695,695,695), c(125, 125, 150, 150,125,125), type = "l", lwd = 3, col = "red") # data frame with points to connect lines(c(105, 105, 105, 695,695,695), c(125, 125, 100, 100,125,125), type = "l", lwd = 3, col = "red") # data frame with points to connect c <- "black" f <- "Times New Roman" ce <- 2 #text(400,125,"Rock",cex = 3, col = c, family=f) #text(400,200,"Side A",cex = 3, col = "Black") #text(400,50,"Side B",cex = 3, col = "Black") text( 400, 200, j_list[ e, 1 ], cex = ce, col = c, family = f ) text( 400, 125, j_list[ e, 2 ] ,cex = ce, col = c, family = f ) text( 400, 50, j_list[ e, 3 ], cex = ce, col = c, family = f ) } g <- g + 8 graphics.off() #browseURL("test.jpg") #browseURL("test2.jpg") #browseURL( paste( "jukebox_" , f, ".jpg", sep = "") ) } # Martin Stoppacher # # office@martinstoppacher.com # # - - - - - - - - - - - - - - - - - - - - - - - - - - - - - - - - - - - - - - - # ################################################################################# |
Created: