# - - - - - - - - - - - - - - - - - - - - - - - - - - - - - - - - - - - - - - - #
# World Bank Data using WDI Package
# path: ~/ownCloud/
# file_name:
# files_used:
# files_created
# - - - - - - - - - - - - - - - - - - - - - - - - - - - - - - - - - - - - - - - #
#
rm(list = ls(all = TRUE))
# - - - - - - - - - - - - - - - - - - - - - - - - - - - - - - - - - - - - - - - #
# packages
#install.packages("httr")
#install.packages("XML")
#install.packages('WDI')
#install.packages("magrittr")
#install.packages("tidyverse")
#install.packages("quantmod")
#install.packages("PerformanceAnalytics")
#install.packages("tidyquant")
library("httr")
library("XML")
library("magrittr")
library("tidyverse")
library("WDI")
library("quantmod")
library("PerformanceAnalytics")
#library("tidyquant")
# - - - - - - - - - - - - - - - - - - - - - - - - - - - - - - - - - - - - - - - #
# - - - - - - - - - - - - - - - - - - - - - - - - - - - - - - - - - - - - - - - #
#
system("ls")
# - - - - - - - - - - - - - - - - - - - - - - - - - - - - - - - - - - - - - - - #
# using quantmod to collect data
# selecting the date while downloading
MCD <- quantmod::getSymbols("MCD",src = "yahoo",
auto.assign=FALSE,
from = "2007-06-01",
to = "2012-07-01" )
head(MCD)
tail(MCD)
# or download the available data and selecting later
MCD <- quantmod::getSymbols("MCD",src = "yahoo",
auto.assign=FALSE )
head(MCD)
tail(MCD)
MCD <- MCD["2007-06-01/2012-07-01"]
head(MCD)
tail(MCD)
# - - - - - - - - - - - - - - - - - - - - - - - - - - - - - - - - - - - - - - - #
# download monthly data
MCD <- quantmod::getSymbols("MCD",src = "yahoo",
auto.assign=FALSE,
from = "2007-06-01",
to = "2012-07-01",
periodicity = "monthly" )
# - - - - - - - - - - - - - - - - - - - - - - - - - - - - - - - - - - - - - - - #
# alternative ways
#stock_list <- c( "IBM", "MCD" )
#
#stocks_weekly <- tq_get(stock_list,
# from = start_date,
# to = end_date,
# periodicity = "weekly")
#stocks_weekly
#install.packages("BatchGetSymbols")
#library(BatchGetSymbols)
#stocks <- BatchGetSymbols( c( "IBM", "MCD" ),
# first.date = "2007-06-01",
# last.date = "2012-07-01",
# freq.data = "monthly",
# how.to.aggregate = 'first')
#stocks
# - - - - - - - - - - - - - - - - - - - - - - - - - - - - - - - - - - - - - - - #
# for now lets use the example time series
IBM <- read.csv("IBM.csv")
MCD <- read.csv("MCD.csv")
head(IBM)
IBM$Adj.Close
MCD$Adj.Close
data <- data.frame(IBM$Adj.Close,MCD$Adj.Close)
data[,3] <- NA
data[,4] <- NA
data
log( IBM$Adj.Close[2] / IBM$Adj.Close[1] )
# log computes logarithms, by default natural logarithms,
# log10 computes common (i.e., base 10) logarithms, and
# log2 computes binary (i.e., base 2) logarithms.
for(i in 2: length(data[,1]) ){
data[i,3] <- ( log( data[i,1] / data[i-1,1] ) )
}
data
for(i in 2: length(data[,2]) ){
data[i,4] <- ( log( data[i,2] / data[i-1,2] ) )
}
data
colnames(data)[3] <- "IBM.Adj.roc"
colnames(data)[4] <- "MCD.Adj.roc"
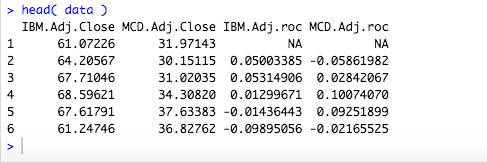
head( data )
#in comparison: the ROC function from the quantmod package
# computes the standard deviation of the values in x. If na.rm is TRUE
# then missing values are removed before computation proceeds.
ROC( data$IBM.Adj.Close )
str( as.numeric( data$IBM.Adj.roc[2] ) )
str( as.numeric( ROC( data$IBM.Adj.Close )[2] ) )
as.numeric( ROC( data$IBM.Adj.Close ) ) == as.numeric( data$IBM.Adj.roc )
as.numeric( ROC( data$IBM.Adj.Close )[2] ) == as.numeric( data$IBM.Adj.roc[2] )
# - - - - - - - - - - - - - - - - - - - - - - - - - - - - - - - - - - - - - - - #
# why are they not exactly the same? Starting with the 16th digit the
# numbers differ.
# the continuous formulation of ROC is : roc <- diff(log(x), n, na.pad = na.pad)
# this gives the small difference compared to what we calculated first
# log( t / (t-1) )
# lets try the same
diff( log( data$IBM.Adj.Close ) )
ROC( data$IBM.Adj.Close )[2:length(data$IBM.Adj.Close)] ==
diff( log( data$IBM.Adj.Close ) )
# now it is exactly the same, but for practical reasons such
# minuscule differences do not really matter.
# - - - - - - - - - - - - - - - - - - - - - - - - - - - - - - - - - - - - - - - #
# if we use the first 5 digits the numbers are exactly the same
print( ROC( data$IBM.Adj.Close )[2], digits = 20 )
print( as.numeric( data$IBM.Adj.roc )[2], digits = 20 )
round( as.numeric( data$IBM.Adj.roc ), 5)
round( as.numeric( ROC( data$IBM.Adj.Close ) ), 5 )
round( as.numeric( data$IBM.Adj.roc ), 5) ==
round( as.numeric( ROC( data$IBM.Adj.Close ) ), 5 )
#options( digits = 10 ) # Modify global options
# - - - - - - - - - - - - - - - - - - - - - - - - - - - - - - - - - - - - - - - #
# the data preparation phase is somewhat more intensive if using
# a programming tool like R but in the long run i think
# i pays off by having more accessible data that can be processed in a
# much faster way especially if it comes to big data applications
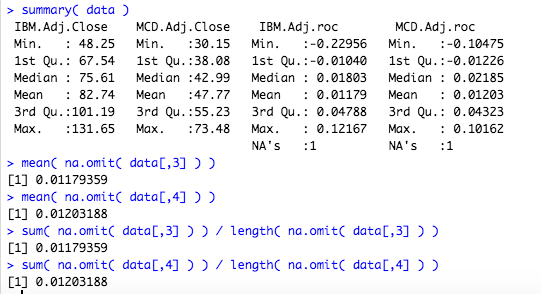
summary( data )
# - - - - - - - - - - - - - - - - - - - - - - - - - - - - - - - - - - - - - - - #
# calculating the mean with a function and out of the data
mean( na.omit( data[,3] ) )
mean( na.omit( data[,4] ) )
sum( na.omit( data[,3] ) ) / length( na.omit( data[,3] ) )
sum( na.omit( data[,4] ) ) / length( na.omit( data[,4] ) )
# - - - - - - - - - - - - - - - - - - - - - - - - - - - - - - - - - - - - - - - #
# latex formulas
# Mean = \frac{1}{N} \sum_{i=1}^{N} r_i # population and sample mean
# - - - - - - - - - - - - - - - - - - - - - - - - - - - - - - - - - - - - - - - #
#
var( na.omit( data[,3] ) )
data[,3] - mean( na.omit( data[,3] ) ) # demeaning
( data[,3] - mean( na.omit( data[,3] ) ) )^2 # power of 2
sum( na.omit( ( data[,3] - mean( na.omit( data[,3] ) ) )^2 ) ) # sum with drop NA
sum( na.omit( ( data[,3] - mean( na.omit( data[,3] ) ) )^2 ) ) /
( length( na.omit( data[,3] ) ) - 1 )
# NA is also omitted for length and we use the sample variance
# therefore we divide by (n-1)
var( na.omit( data[,4] ) )
# - - - - - - - - - - - - - - - - - - - - - - - - - - - - - - - - - - - - - - - #
# latex formulas
# Var.p = \frac{1}{N} \sum_{i=1}^{N} (r_i-\bar{r})^2
# Var.s = \frac{1}{N-1} \sum_{i=1}^{N} (r_i-\bar{r})^2
# - - - - - - - - - - - - - - - - - - - - - - - - - - - - - - - - - - - - - - - #
#
# stats:: calls the package directly
# this is not really necessary unless there are functions with the
# same name in different packages. Then one might be masked be the other
# SD IBM
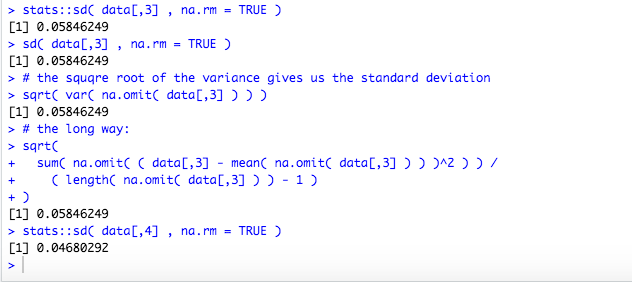
stats::sd( data[,3] , na.rm = TRUE )
sd( data[,3] , na.rm = TRUE )
# the squqre root of the variance gives us the standard deviation
sqrt( var( na.omit( data[,3] ) ) )
# the long way:
sqrt(
sum( na.omit( ( data[,3] - mean( na.omit( data[,3] ) ) )^2 ) ) /
( length( na.omit( data[,3] ) ) - 1 )
)
# SD MCD
stats::sd( data[,4] , na.rm = TRUE )
# - - - - - - - - - - - - - - - - - - - - - - - - - - - - - - - - - - - - - - - #
# latex formulas standard deviation
#Stdev.p = \sqrt{ \frac{1}{N} \sum_{i=1}^{N} (r_i-\bar{r})^2 }
#Stdev.s = \sqrt{ \frac{1}{N-1} \sum_{i=1}^{N} (r_i-\bar{r})^2 }
# - - - - - - - - - - - - - - - - - - - - - - - - - - - - - - - - - - - - - - - #
# calculate covariance
cov( na.omit(data$IBM.Adj.roc), na.omit(data$MCD.Adj.roc) )
# this gives the sample covariance
# calculation by hand
na.omit( data$IBM.Adj.roc ) - mean( na.omit( data$IBM.Adj.roc ) )
na.omit( data$MCD.Adj.roc ) - mean( na.omit( data$MCD.Adj.roc ) )
( na.omit( data$IBM.Adj.roc ) - mean( na.omit( data$IBM.Adj.roc ) ) )*
( na.omit( data$MCD.Adj.roc ) - mean( na.omit( data$MCD.Adj.roc ) ) )
sum(
( na.omit( data$IBM.Adj.roc ) - mean( na.omit( data$IBM.Adj.roc ) ) )*
( na.omit( data$MCD.Adj.roc ) - mean( na.omit( data$MCD.Adj.roc ) ) )
) /
length( na.omit( data$IBM.Adj.roc ) ) * 60/59
# length( na.omit( data$IBM.Adj.roc ) ) == 60
# Population covariance
# * (n-1)/n
cov( na.omit(data$IBM.Adj.roc), na.omit(data$MCD.Adj.roc) ) * (60-1)/60
# - - - - - - - - - - - - - - - - - - - - - - - - - - - - - - - - - - - - - - - #
# latex formulas Covariances
# Covariance.p = \frac{1}{N} \sum_{t=1}^{N} (r_{it}-\bar{r}_i)(r_{jt}-\bar{r}_j)
# Covariance.s = \frac{1}{N-1} \sum_{t=1}^{N} (r_{it}-\bar{r}_i)(r_{jt}-\bar{r}_j)
# - - - - - - - - - - - - - - - - - - - - - - - - - - - - - - - - - - - - - - - #
# calculating correlation - sample correlation
cor( na.omit(data$IBM.Adj.roc), na.omit(data$MCD.Adj.roc) )
cov( na.omit(data$IBM.Adj.roc), na.omit(data$MCD.Adj.roc) ) /
( sqrt( var( na.omit( data[,3] ) ) ) * sqrt( var( na.omit( data[,4] ) ) ) )
# - - - - - - - - - - - - - - - - - - - - - - - - - - - - - - - - - - - - - - - #
# latex formulas Correlation
# Correl(i,j) = \frac{Covar.p(i,j)}{Stdev.p(i)*Stdev.p(j)}
# the full formula
# Correl(i,j) = \frac{Covariance.p = \frac{1}{N} \sum_{t=1}^{N} (r_{it}-\bar{r}_i)(r_{jt}-\bar{r}_j)}{Stdev.p_{(i)} = \sqrt{ \frac{1}{N} \sum_{t=1}^{N} (r_{it}-\bar{r}_i)^2 }*Stdev.p_{(j)} = \sqrt{ \frac{1}{N} \sum_{t=1}^{N} (r_{jt}-\bar{r}_j)^2 }}
# - - - - - - - - - - - - - - - - - - - - - - - - - - - - - - - - - - - - - - - #
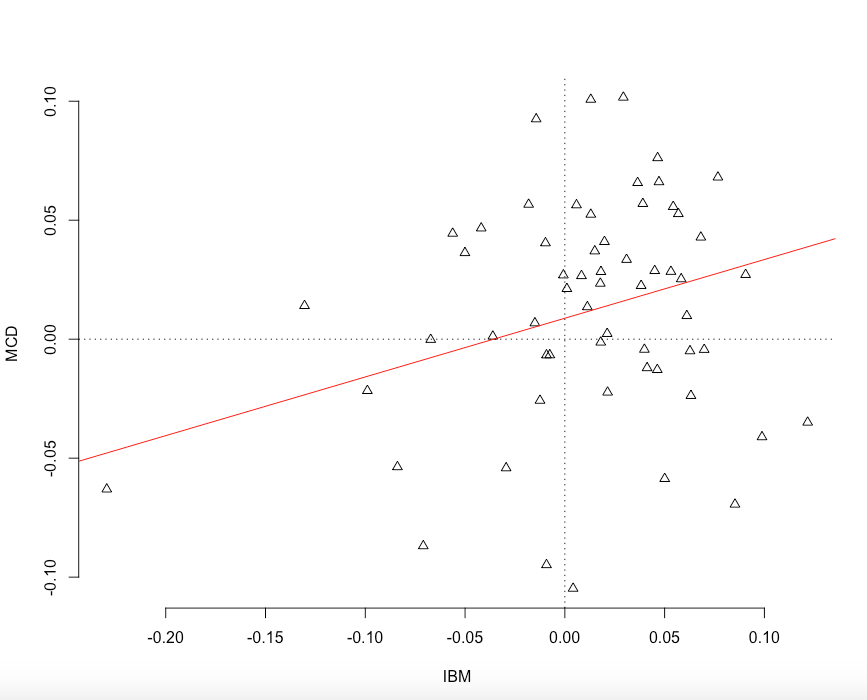
# ploting return series
plot( na.omit(data$IBM.Adj.roc), na.omit(data$MCD.Adj.roc),
xlab = "IBM",
ylab = "MCD", frame.plot = FALSE,
axes = TRUE,
xgap.axis = 4,
ygap.axis = 4,pch=2)
model <- lm( na.omit(data$IBM.Adj.roc) ~ na.omit(data$MCD.Adj.roc) )
abline(model$coefficients, col="red")
abline( h=0, v=0, lty = 3 )
# - - - - - - - - - - - - - - - - - - - - - - - - - - - - - - - - - - - - - - - #
# calculating portfolio performance
data[,3:4]
ratio.ibm <- 0.5
ratio.mcd <- (1 - ratio.ibm)
data[,5] <- NA
data
for(i in 2: length(data[,3]) ){
data[i,5] <- ( data[i,3] * ratio.ibm ) + ( data[i,4] * ratio.mcd )
}
colnames(data)[5] <- "portfolio.performance"
data
head( data )
# - - - - - - - - - - - - - - - - - - - - - - - - - - - - - - - - - - - - - - - #
# portfolio performance values
mean( na.omit( data$portfolio.performance ) )
var( na.omit( data$portfolio.performance ) )
sqrt( var( na.omit( data$portfolio.performance ) ) )
# sd( na.omit( data$portfolio.performance ) )
# - - - - - - - - - - - - - - - - - - - - - - - - - - - - - - - - - - - - - - - #
# calculating different portfolios
ratios <- seq( 0, 1, by = 0.1 )
result <- NULL
for(i in 1:length(ratios) ) {
ratio.ibm <- ratios[i]
ratio.mcd <- (1 - ratio.ibm)
data[,5] <- NA
data
for(i in 2: length(data[,3]) ){
data[i,5] <- ( data[i,3] * ratio.ibm ) + ( data[i,4] * ratio.mcd )
}
colnames(data)[5] <- "portfolio.performance"
m <- mean( na.omit( data$portfolio.performance ) )
s <- sqrt( var( na.omit( data$portfolio.performance ) ) )
frame <- data.frame( m, s )
result <- data.frame( rbind( result, frame ) )
}
result
# - - - - - - - - - - - - - - - - - - - - - - - - - - - - - - - - - - - - - - - #
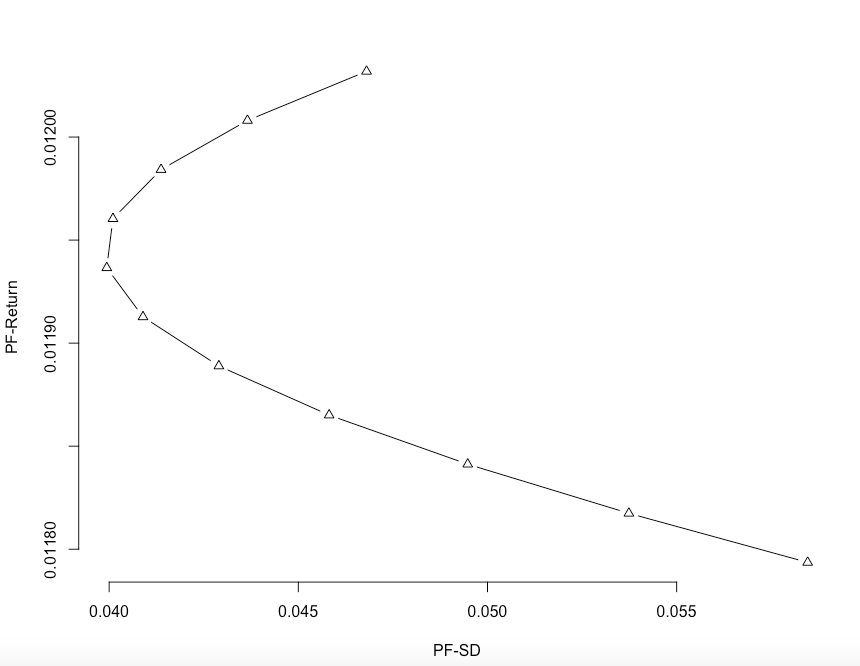
# ploting values
plot( result$s, result$m,
type = "b",
xlab = "PF-SD",
ylab = "PF-Return", frame.plot = FALSE,
axes = TRUE,
xgap.axis = 4,
ygap.axis = 4,pch=2)
#model <- lm( result$m ~ result$s )
#abline(model$coefficients, col="red")
plot( result$s, result$m,
type = "b",
xlim = c(0.035,0.06),
ylim = c(0.0117,0.0122),
xlab = "PF-SD",
ylab = "PF-Return", frame.plot = FALSE,
axes = TRUE,
xgap.axis = 4,
ygap.axis = 4,
pch=2)
# - - - - - - - - - - - - - - - - - - - - - - - - - - - - - - - - - - - - - - - #
# calculating more portfolios values including the option for shorting
ratios <- seq( -3, 3, by = 0.1 )
result <- NULL
for(i in 1:length(ratios) ) {
ratio.ibm <- ratios[i]
ratio.mcd <- (1 - ratio.ibm)
data[,5] <- NA
data
for(i in 2: length(data[,3]) ){
data[i,5] <- ( data[i,3] * ratio.ibm ) + ( data[i,4] * ratio.mcd )
}
colnames(data)[5] <- "portfolio.performance"
m <- mean( na.omit( data$portfolio.performance ) )
s <- sqrt( var( na.omit( data$portfolio.performance ) ) )
frame <- data.frame( m, s, ratio.ibm, ratio.mcd )
result <- data.frame( rbind( result, frame ) )
}
result
# - - - - - - - - - - - - - - - - - - - - - - - - - - - - - - - - - - - - - - - #
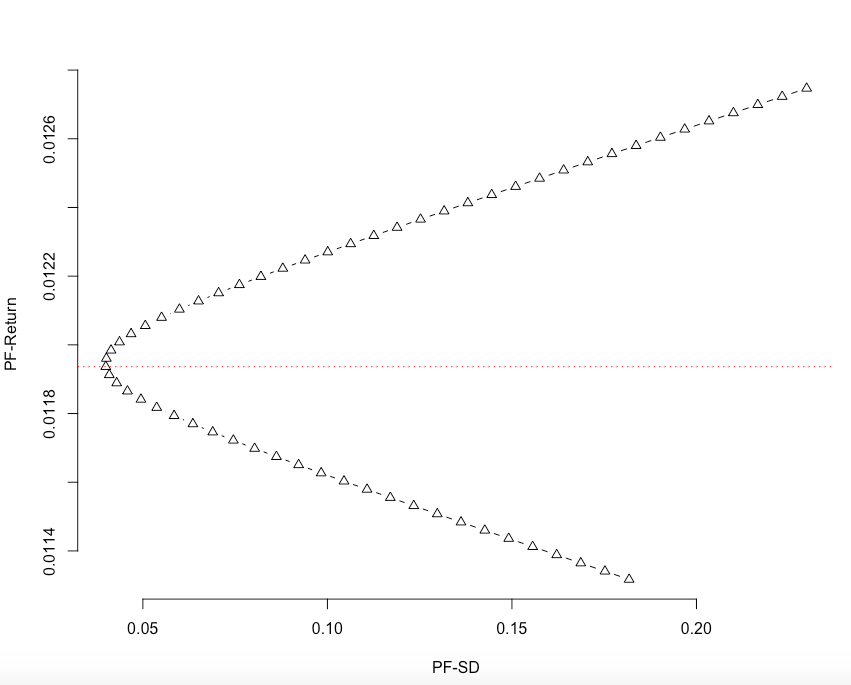
# ploting values
plot( result$s, result$m,
type = "b",
xlab = "PF-SD",
ylab = "PF-Return", frame.plot = FALSE,
axes = TRUE,
xgap.axis = 4,
ygap.axis = 4,pch=2)
which( round( result$s,4) == round(min( result$s ),4) )
sep.line <- result[which( round( result$s,4) == round(min( result$s ),4) ),1]
abline( h = sep.line , lty = 3, col = "red")
# - - - - - - - - - - - - - - - - - - - - - - - - - - - - - - - - - - - - - - - #
# The next step would be to calculate values for n asset portfolio
min( result$s )
dplyr::filter( result, s == min( result$s ) )
# - - - - - - - - - - - - - - - - - - - - - - - - - - - - - - - - - - - - - - - #
# latex vector notation
# x=\begin{bmatrix} x_1 \\ x_2 \\ ... \\ x_N \end{bmatrix}
