Category Archives: Economics

ARCH/GARCH modelling


S&P 500 growth 1975 – 2014

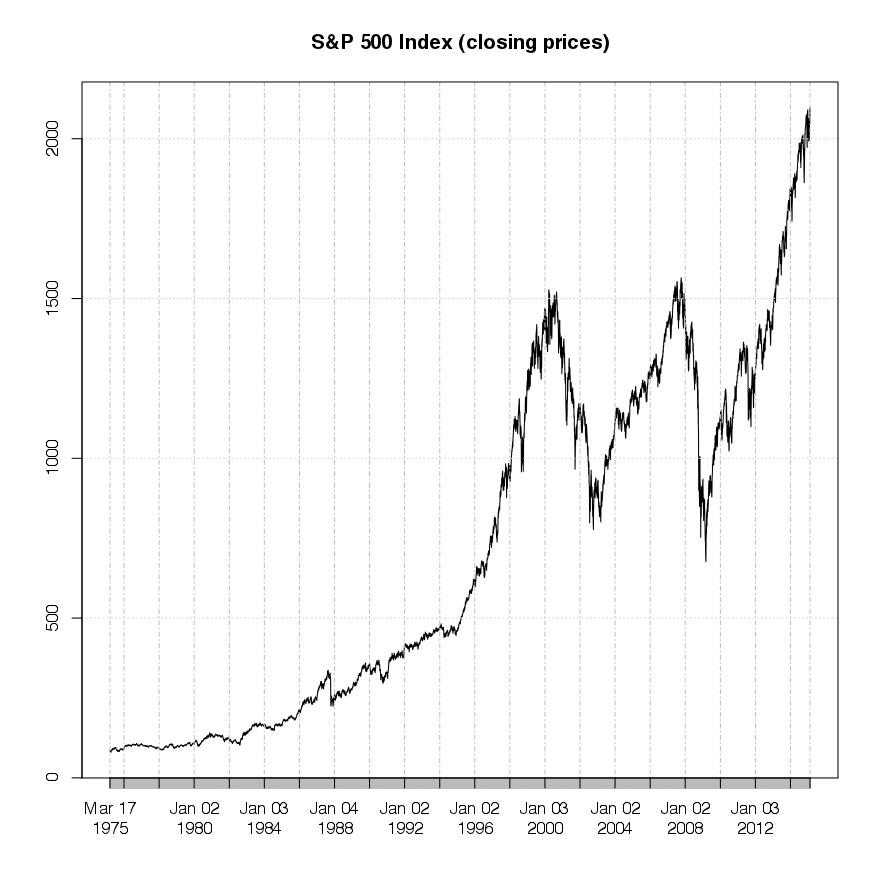
Just a few graphs on the development of the S&P500 Index from 1975 – 2014, using data from yahoo finance.

The first graph shows the price movement of the index for the time period from 1975 to 2014 (available data at yahoo finance), with slower but rather constant growth in the first half of the time period and higher growth in the second. And of course the two major set backs from 2000-2003 and 2007-2009 are clearly visible.

SP500.jpg1975-2015

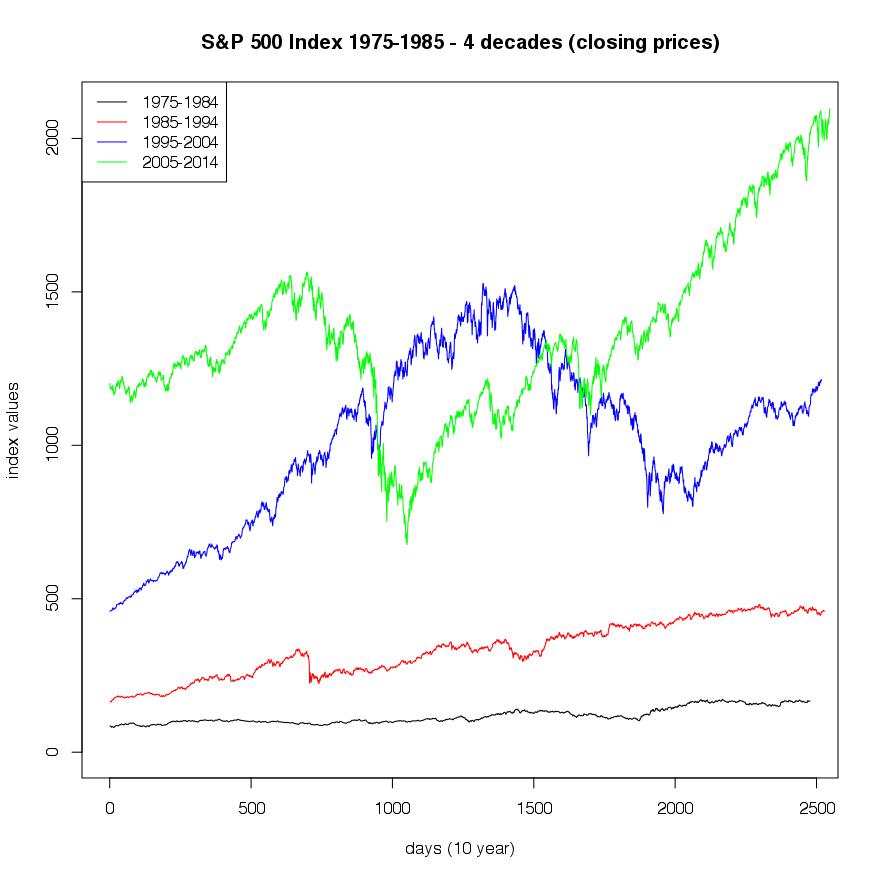
The next graph presents the same time series separated into decades, merged together into one graph. It is easy to see that there is a constant positive development within the different decades (with respect to the choice of truncation). The question arising now is, in which period did the most change in index value occur. The answer to this question kind of turns the plot on its head. It can be found in the next graph.

SP500.jpg 1975-2005 4decades-new


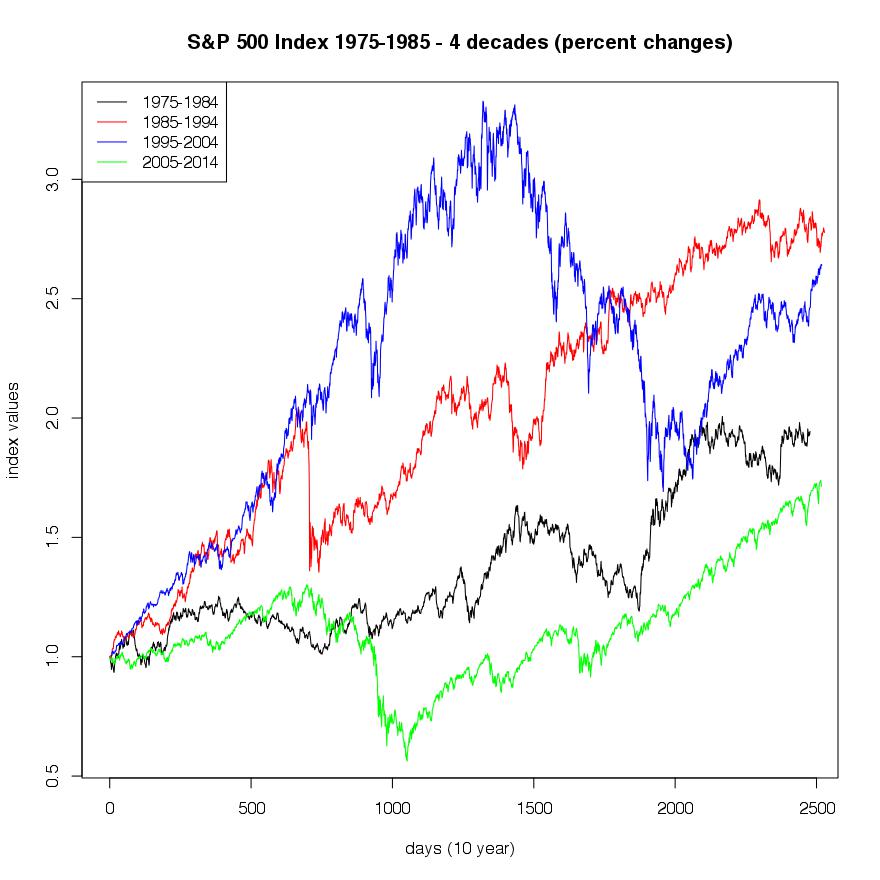
Regarding the question from above the following plot shows the same development in percent values, for the individual decades, included into one graph. Now the separation between the periods becomes more clear, with the highest movement between 1985-1995 and the lowest between 2005 and 2014.

SP500.jpg 1975-2005 4decades percent-new

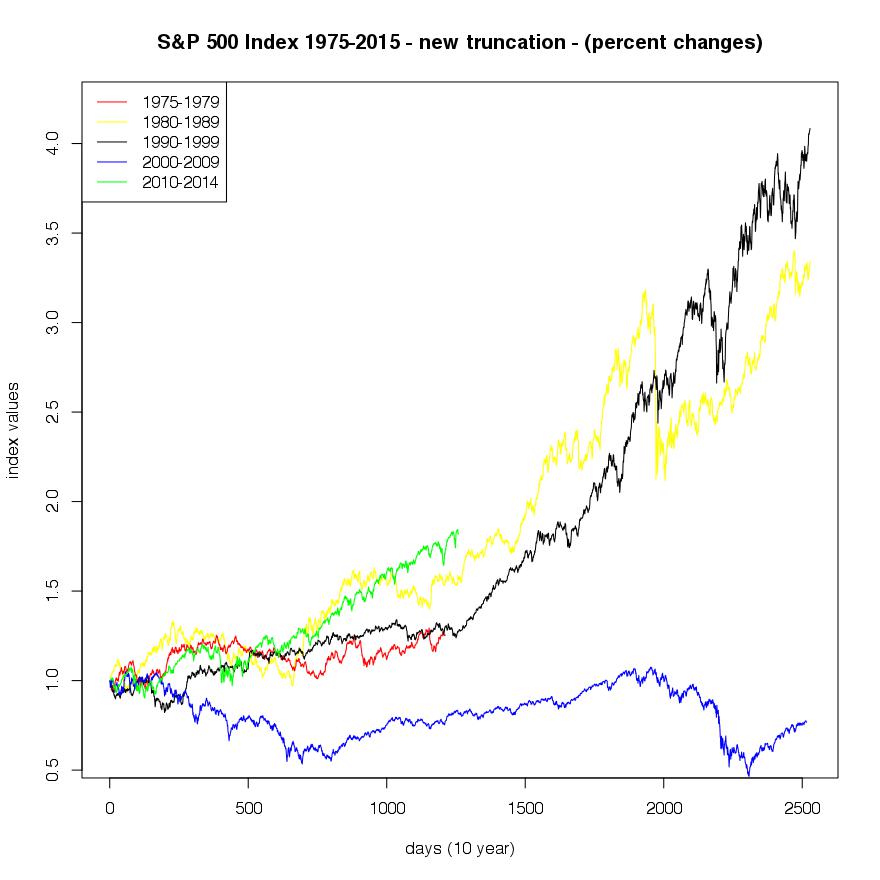
An other interesting effect appears  when we modify the truncation of the single decades. E.g. if we observe the time frames from 1980-1990, 1990-2000, 2000-2010, an so on. 3 decades of the index development are strongly positive whereas 1 decade shows a negative development (2000-2010), indicating the possible importance of timing models.

SP500.jpg 1975-2005 4otherdecades percent2-new


  • http://finance.yahoo.com/q?s=%5EGSPC

Analyzing the World GDP Development using R

This is just a simple example of how to download and visualize data from the web by using the R-Project framework. Specifically data tables including GDP values from the world-bank data section are used which include absolute GDP per country data from 1980 to 2012.

http://data.worldbank.org/indicator/NY.GDP.MKTP.CD/countries/1W?display=default

There are 7 tables including 4 – 5 years of GDP data each. What this script does is to download each of this tables and merge it together into a single data frame which makes the data easily accessible for further analysis.

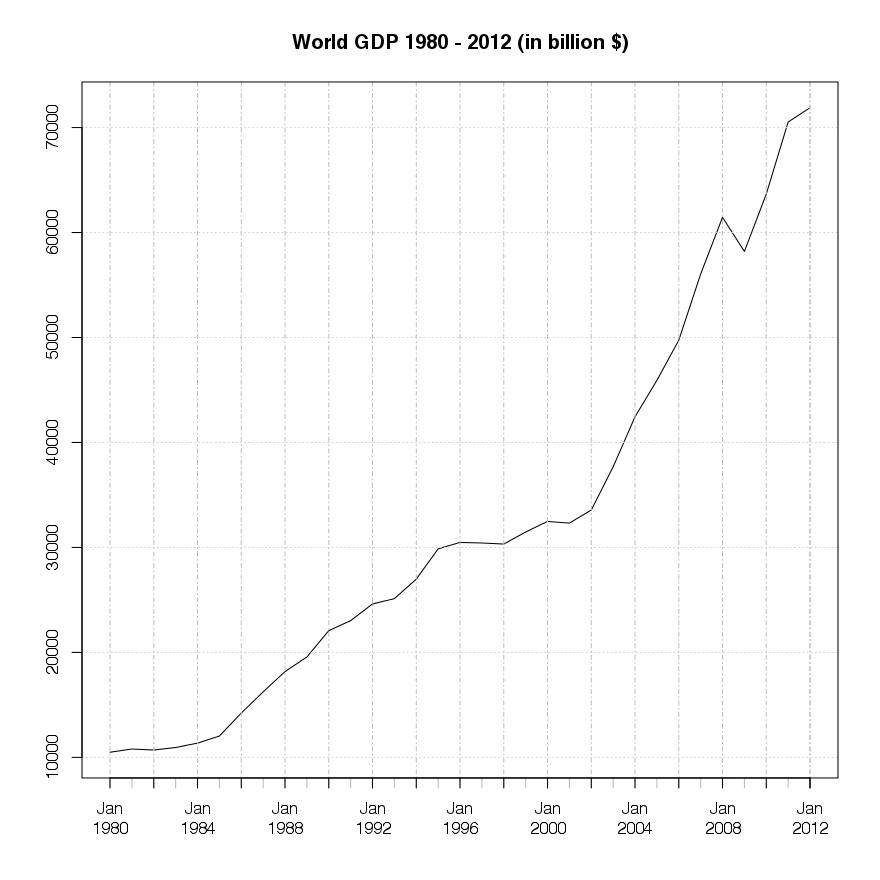
If we simply sum up all the single absolute GDP values per year we get the world GDP values for the period 1980 – 2012. The graphic below shows this development, measured in billions of USD.

World GDP 1980 -2012
 
Its easy to see that there are two periods of stronger growth as well as a period of stagnation around 1996 – 2002, which might be explained trough the asia financial crisis in 1997/98 and the dot com bubble turmoil. But it is interesting that, as compared to the impact of the global financial crisis in 2007/08, there was no severe setback in the world GDP output in this earlier period. 
The impact of the subprime crisis driven, globaly spread, financial crisis in 2007 – 2008 is easily observable in the graphic above, though it comes with an expected time delay of one year. The global output value for the year 2007/08 was still growing while the financial downturn was already spreading on a global level (this can be seen by taking a look at different major stock market indices around the world – which i will try to show in an other post). The setback in GDP output came one year later in 2009, where we can see a strong setback in the plot, but with a recovery in output another year later in 2010.
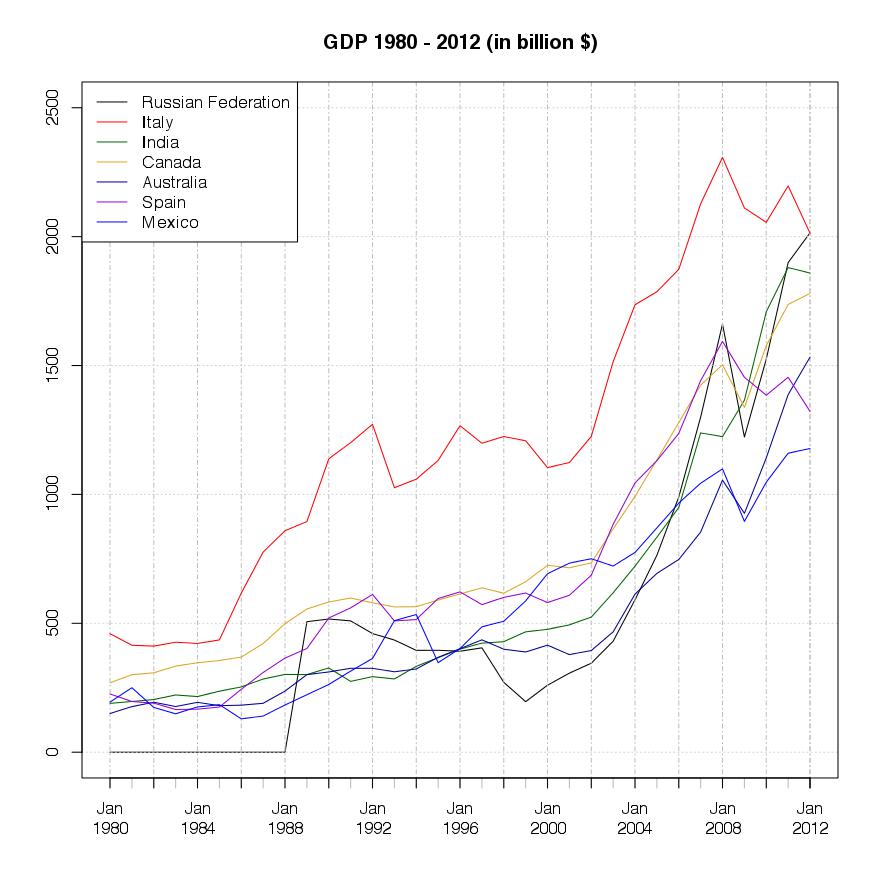
Here is an other example of a simple output for the seven wealthiest countries in the world, measured by their absolute GDP value, from 1980 to 2012.
GDP top 7 countries in 1980 - 2012
GDP top 7 countries in 2012

The similarity of the US output compared to the world GDP output is very obvious at first sight, showing the same setback in 2009 but no stagnation trough the 1998 – 2002 period. The fact that there is no setback in GDP output trough that period might indicate a week relationship between the financial turmoil in that time and the real economic output.

An other interesting fact is the growth of Chinas output, especially from 2002 onwards. This opens up the question on further resaerch on the reasons for this rapid growth and if some kind of regime switch occured turing that time . This rapid growth change lets China take the worlds second place, measured inabsolute GDP output, which makes China the second riches nation in the world, measured in absolute GDP value, from 2009 onwards.

The last graphic is for the 8-14 ranked countries, measured by their absolute GDP USD value.

GDP top 8 - 14 Countries in 2012
GDP top 8 – 14 Countries in 2012


Ok, so here is the code:

Basically i use two packages for these simple analytics. The “XML” packages is used to gather the data from the worldbank database and the “gridExtra” package is used for the graphical representation of a given dataset.  The rest of the functionality already comes with the standard installation of the r-project software package.

The first step in the process is to download all the available data sets from the worldbank database and merge it together into one single data frame. This provides us with the opportunity of easy data handling. (Straight forward i just downloaded all the sets of data. Of course it would be possible to compress and automate this process by using loops, … , but i will try to cover this possibility at an other point here. As well as the automated gathering of data from different web sources, such as worldbank data, imf data, yahoo data, google data, quandl data, …)

Once we gathered all the GDP data in one frame it is necessary to transform and clean some of the data. This is due to the fact that some of the cells in the data frame have no values (i.e. NA values in R) or they are in the wrong data formate (e.g. a character instead of numeric)

Basically we replace all NA values with a numerical 0, set all entries to numerical values and add the column names, which are the respective years of the data series, to the data frame.

The results from this process can the seen in the plot below, which is a presentation of a part of the whole compiled table.

Output 1:

World GDP Distribution
World GDP Data by Country

The next step is the graphical representation of the data which is the main goal of this short research. Therefore we apply the transpose function for the data frame and use the “xts” framework for time series handling and graphical output.

For the first plot (the cumulative world GDP) we have to process an other step before we can present the data. The single values for each country have to be summed up for each year to get the value for the world GDP of that specific year.

Output 2:

World GDP 1980 -2012

Plots for the top 7 countries measured in GDP value:

Output 3:

GDP top 7 countries in 2012

Plots for the top 8-14 countries measured in GDP value:

Output 4:

GDP top 8 - 14 Countries in 2012
GDP top 8 – 14 Countries in 2012

– – – – – – – – – – – – – – – – – – – – – – – – – – – – – – – – – – – – – – – – – – – – – –

Please note that i do not always try to produce perfectly efficient code in a programming attitude but rather focus on the results and sociological, econometrical, … , insights gathered trough the process of data analytics.

If my focus especially belongs to coding i will try to catch that with an unique post, just for this specific topic. Nevertheless i strongly appreciate suggestions, additions and/or correction in both the analytical insights and the data analytical process and programming code.

– – – – – – – – – – – – – – – – – – – – – – – – – – – – – – – – – – – – – – – – – – – – – –

Data Source:  data.worldbank.org/

Software: www.rproject.org/
– – – – – – – – – – – – – – – – – – – – – – – – – – – – – – – – – – – – – – – – – – – – – –
Martin Stoppacher,  © 2014