An easy and free way to add a master EQ/FX/... to your OSX System - and include correction curves for your Headphones
An easy and free way to add a master EQ/FX/… to your OSX System. This can also be used to include correction curves for your Headphones.
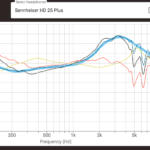
Lets say we want to correct the curve of a pair of Sennheiser HD-25 Plus Headphones.
Therefore we use the AutoEQ web application. This shows the...Read More »
Data examples using World Bank Data
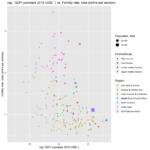
Data examples using World Bank Data in combination with the ggplot package in R.
Tidyverse methods and functions were used to generate a combined data frame (tibble) for all countries and indicators.
[crayon-6638b868ab01b310924416/]
[crayon-6638b868ab023305880290/]
[crayon-6638b868ab027466581653/]
[crayon-6638b868ab02a547153718/]
[crayon-6638b868ab02e209119905/]
[crayon-6638b868ab031454597596/]
[crayon-6638b868ab033051709163/]
[crayon-6638b868ab037252871525/]
...Read More »
 [crayon-6638b868ac05a835709767/]
Original:
[crayon-6638b868ac05a835709767/]
Original:
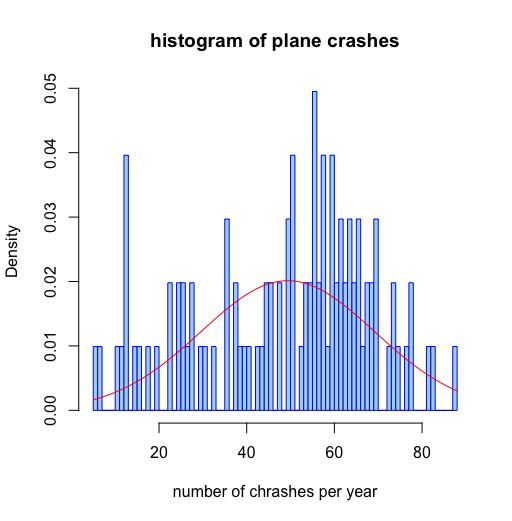
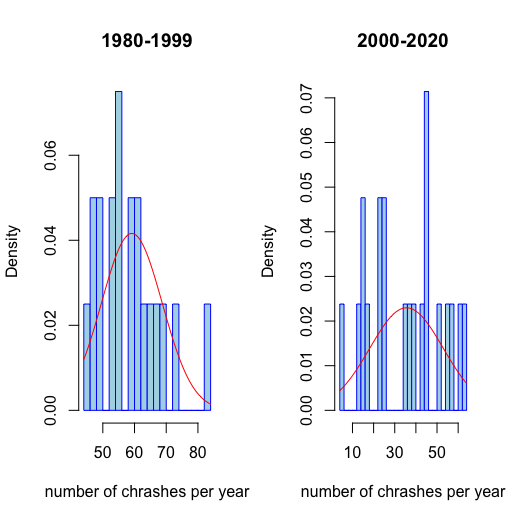
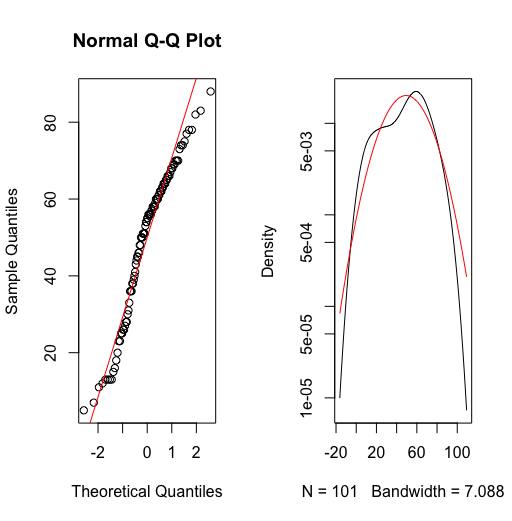
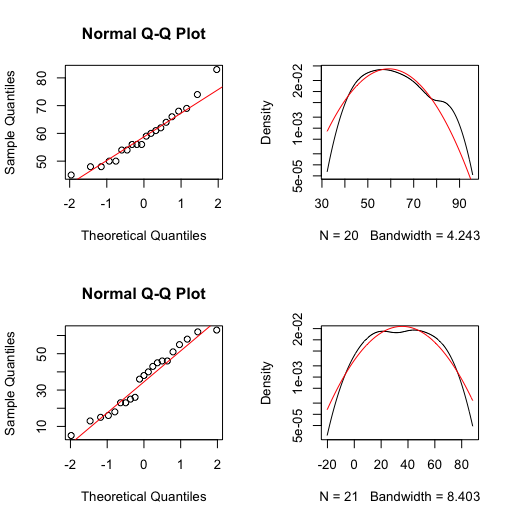
Basic R commands – 2 - probability distributions
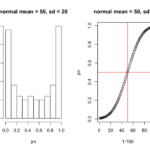
Basic Commands and Statistics with R – 2 – probability distibutions. R Functions for the most common probability distibutions.
[crayon-6638b868acde5522259335/]
[crayon-6638b868acdec370667805/]
[crayon-6638b868acdf0011706607/]
[crayon-6638b868acdf3151649801/]
[crayon-6638b868acdf6531749987/]
[crayon-6638b868acdf8877048531/]
[crayon-6638b868acdfd121475076/]
[crayon-6638b868ace02612719836/]
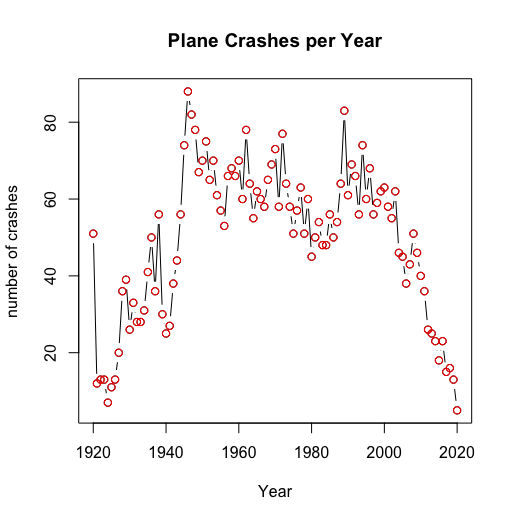
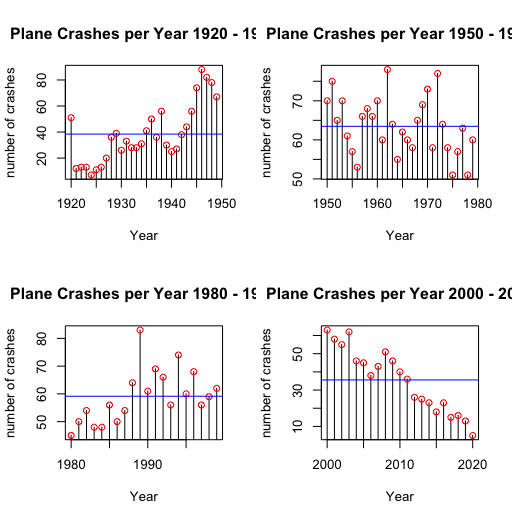
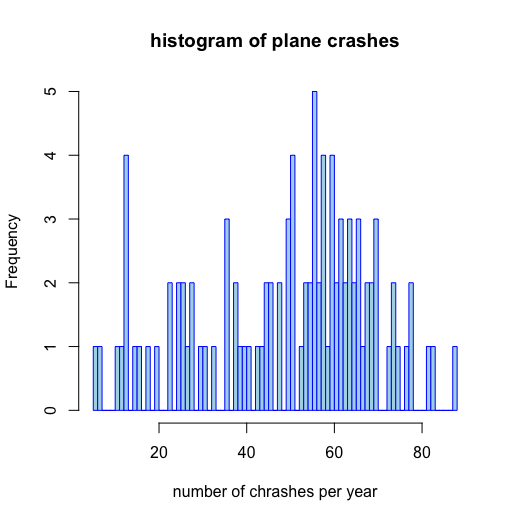
world_population_plots
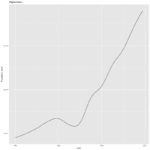
world_population_plots
MST
23 7 2020
population time series plots for all countries from the worldbank dataset.
– – – – – – – – – – – – – – – – – – – – – – – – – – – – –...Read More »
Basic R commands - 1.2 - permutations and matrix functions
[crayon-6638b868b128b402839477/] [crayon-6638b868b1297286232599/] ...Read More »Basic R commands - 1
 [crayon-6638b868b26ba881462459/]
[crayon-6638b868b26c5989778711/]
[crayon-6638b868b26ca963673787/]
[crayon-6638b868b26ce899426692/]
...Read More »
Renewable electricity output – World Map
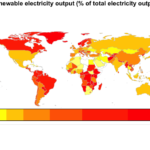 [crayon-6638b868cee40418910035/]
[crayon-6638b868cee47663022245/]
...Read More »
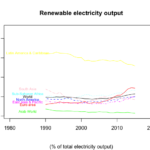
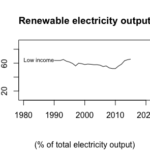
Renewable electricity output - Statistics
 [crayon-6638b868cfc73509594740/]
[crayon-6638b868cfc7a627361232/]
[crayon-6638b868cfc73509594740/]
[crayon-6638b868cfc7a627361232/]
[crayon-6638b868cfc7e272751086/] # income categories
– Low income
– Lower middle income
– Upper middle income
– High income
[crayon-6638b868cfc81161905113/]
[crayon-6638b868cfc84142108360/]
[crayon-6638b868cfc87427888951/]
...Read More »
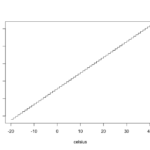
Using trigonometric functions in R
R uses radiant as input for trigonometric functions.
[crayon-6638b868d0b6c966569615/]
Now we can plot the function.
[crayon-6638b868d0b73135842249/]
And by playing with the functions we get a funny graphic output.
[crayon-6638b868d0b77287825702/]
And if we include the tangent, the graphic looks like this:
[crayon-6638b868d0b7a719730929/]
[crayon-6638b868d0b7e867767217/]
[crayon-6638b868d0b80229538377/]
Audio file conversion with afconvert (mac)
I was looking for a simple and elegant way to convert a high amount of audio files from one format (.caf) to another (.aif). The solution i found is a very elegant one and also comes included with your operating system – if using a MAC.
[crayon-6638b868d1c59523528728/]
And now here is...Read More »
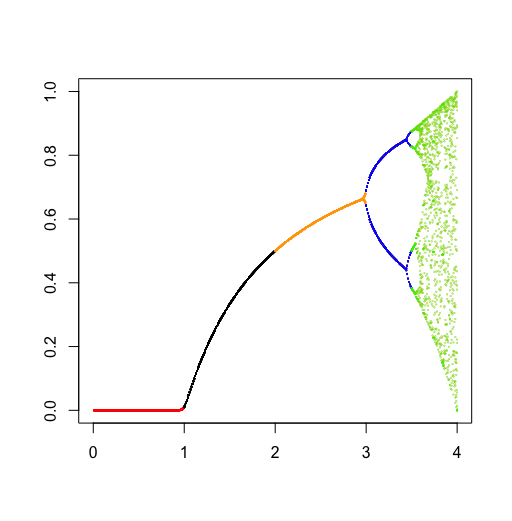
bifurcation tree with R

Lately i was exploring the logistic map function because i was fascinated again how chaotic behavior can arise from very simple circumstances (i.e. a rather simple equation).
Of course, i learned about this in school but never got a chance to write some code.
So here it is. 🙂
And...Read More »
Creating a beat frequency interference with R
A beat frequency is a mix of two frequencies which are very close to each other but not similar. The trick is that they are to close to each other to be separated by the human ear as two distinct frequencies, thus generating a single tone with fluctuating amplitude behavior...Read More »
Implementing a MySQL DB connection via ooRexx by using BSF4ooRexx - (3_MySql_connector.rxj)
[crayon-6638b868d630a575813710/]- the Open Object Rexx (ooRexx) web site
- ROME is a set of RSS and Atom Utilities for Java
- Introduction to REXX and ooRexx – Flatscher Rony G.
- http://wi.wu-wien.ac.at:8002/rgf/
- http://wi.wu-wien.ac.at/rgf/diplomarbeiten/BakkStuff/2010/201001_Stoppacher/Project_Rome_in_combination_with_BSF4ooRexx_Presentation.pdf
...Read More »
GDP and Life expectancy
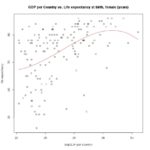
[crayon-6638b868d6df3029878197/]
[crayon-6638b868d6dfc268192863/]
ooRexx with BSF4ooRexx - "java,net.URL" Classes (2_getinfo.rxj)
[crayon-6638b868d76b5254477075/]- http://www.oorexx.org/
- http://sourceforge.net/projects/oorexx/
- http://rometools.github.io/rome/
- http://wi.wu-wien.ac.at/rgf/diplomarbeiten/BakkStuff/2010/201001_Stoppacher/Project_Rome_in_combination_with_BSF4ooRexx_Presentation.pdf
Syndication Feed Reader (1_Read.rxj) - ooRexx with BSF4ooRexx
[crayon-6638b868d7cbd667164901/]- http://www.oorexx.org/
- http://sourceforge.net/projects/oorexx/
- http://rometools.github.io/rome/
- http://wi.wu-wien.ac.at/rgf/diplomarbeiten/BakkStuff/2010/201001_Stoppacher/Project_Rome_in_combination_with_BSF4ooRexx_Presentation.pdf
Analyzing the World GDP Development using R
This is just a simple example of how to download and visualize data from the web by using the R-Project framework. Specifically data tables including GDP values from the world-bank data section are used which include absolute GDP per country data from 1980 to 2012.
Content syndication with the Project ROME Java API by using the open object scripting language ooRexx with BSF4ooRexx
Content syndication with the Project ROME Java API
by using the open object scripting language ooRexx
with BSF4ooRexx
–
Project Rome in combination with BSF4ooRexx
Martin Stoppacher
2010
Abstract
An example of a syndication feed reader using the Project Rome API with BSF4ooRexx - "java.net.URL" feed reader (2_Rome.rxj)
[crayon-6638b868e9910320824487/]- http://www.oorexx.org/
- http://sourceforge.net/projects/oorexx/
- http://rometools.github.io/rome/
- http://www.facultas.at/list/SFRE8554C
- http://wi.wu-wien.ac.at/rgf/diplomarbeiten/BakkStuff/2010/201001_Stoppacher/Project_Rome_in_combination_with_BSF4ooRexx_Presentation.pdf
Syndication feed reader using the Project Rome API - (1_FeedReader.java)
[crayon-6638b868ea0c5550001050/]R Code:
Data examples using World Bank Data
Data examples using World Bank Data in combination with the ggplot package in R.
Tidyverse methods and functions were used to ...
Java Code:
ooRexx Code:


