|
1 2 3 4 5 6 7 8 9 10 11 12 13 14 15 16 17 18 19 20 21 22 23 24 25 26 27 28 29 30 31 32 33 34 35 36 37 38 39 40 41 42 43 44 45 46 47 48 49 50 51 52 53 54 55 56 57 58 59 60 61 62 63 64 65 66 67 68 69 70 71 72 73 74 75 76 77 78 79 80 81 82 83 84 85 86 87 88 89 90 91 92 93 94 95 96 97 98 99 100 101 102 103 104 105 106 107 108 109 110 111 112 113 114 115 116 117 118 119 120 121 122 123 124 125 126 127 128 129 130 131 132 133 134 135 136 137 138 139 140 141 142 143 144 145 146 147 148 149 150 151 152 153 154 155 156 157 158 159 160 161 162 163 164 165 166 167 168 169 170 171 172 173 174 175 176 177 |
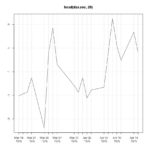
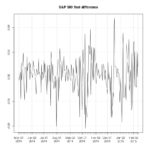
# - - - - - - - - - - - - - - - - - - - - - - - - - - - - - - - - - - - - - - - - - - - # # install.packages("seewave") require("seewave") install.packages("tuneR") require("tuneR") #rm(list = ls(all = TRUE)) # clear current workspace # setwd("/Users/martinstoppacher/R Analysis/3_Index Sounds/") library("quantmod") getSymbols("^GSPC",from=1900) head(GSPC) tail(GSPC) jpeg(filename = "SP500.jpg1975-2015.jpg", width=880,height=880,res=100) plot(Cl(GSPC),main="S&P 500 Index (closing prices)") dev.off() summary(Cl(GSPC)) jpeg(filename = "SP500.jpg1975-1985.jpg", width=880,height=880,res=100) plot(Cl(GSPC)["1975/1985"],main="S&P 500 Index 1975-1985 (closing prices)") dev.off() jpeg(filename = "SP500.jpg1985-1995.jpg", width=880,height=880,res=100) plot(Cl(GSPC)["1985/1995"],main="S&P 500 Index 1985-1995 (closing prices)") dev.off() jpeg(filename = "SP500.jpg1995-2005.jpg", width=880,height=880,res=100) plot(Cl(GSPC)["1995/2005"],main="S&P 500 Index 1995-2005 (closing prices)") dev.off() jpeg(filename = "SP500.jpg2005-2015.jpg", width=880,height=880,res=100) plot(Cl(GSPC)["2005/2015"],main="S&P 500 Index 2005-2015 (closing prices)") dev.off() jpeg(filename = "SP500.jpg 1975-2005 4decades-new.jpg", width=880,height=880,res=100) plot(as.numeric(Cl(GSPC)["1975/1984"]),main="S&P 500 Index 1975-1985 - 4 decades (closing prices)",ylim=c(0,2100),type="l",ylab="index values",xlab="days (10 year)") lines(as.numeric(Cl(GSPC)["1985/1994"]),col="red") lines(as.numeric(Cl(GSPC)["1995/2004"]),col="blue") lines(as.numeric(Cl(GSPC)["2005/2015"]),col="green") legend("topleft", legend = c("1975-1984","1985-1994","1995-2004","2005-2014") , lty = 1, col = c("black","red","blue","green")) dev.off() jpeg(filename = "SP500.jpg 1975-2005 4decades percent-new2.jpg", width=880,height=880,res=100) plot((as.numeric(Cl(GSPC)["1975/1984"])/as.numeric(Cl(GSPC)["1975/1984"][1])-1),main="S&P 500 Index 1975-1985 - 4 decades (percent changes)",ylim=c(-0.4,2.3),type="l",ylab="index values",xlab="days (10 year)") lines((as.numeric(Cl(GSPC)["1985/1994"])/as.numeric(Cl(GSPC)["1985/1994"][1])-1),col="red") lines((as.numeric(Cl(GSPC)["1995/2004"])/as.numeric(Cl(GSPC)["1995/2004"][1])-1),col="blue") lines((as.numeric(Cl(GSPC)["2005/2014"])/as.numeric(Cl(GSPC)["2005/2014"][1])-1),col="green") legend("topleft", legend = c("1975-1984","1985-1994","1995-2004","2005-2014") , lty = 1, col = c("black","red","blue","green")) dev.off() jpeg(filename = "SP500.jpg 1975-2005 4otherdecades percent2-new.jpg", width=880,height=880,res=100) plot(as.numeric(Cl(GSPC)["1980/1989"])/as.numeric(Cl(GSPC)["1980/1989"][1]),main="S&P 500 Index 1975-2015 - new truncation - (percent changes)",ylim=c(0.6,4.2),type="l",ylab="index values",xlab="days (10 year)",col="yellow") lines(as.numeric(Cl(GSPC)["1975/1979"])/as.numeric(Cl(GSPC)["1975/1979"][1]),col="red") lines(as.numeric(Cl(GSPC)["1990/1999"])/as.numeric(Cl(GSPC)["1990/1999"][1]),col="black") lines(as.numeric(Cl(GSPC)["2000/2009"])/as.numeric(Cl(GSPC)["2000/2009"][1]),col="blue") lines(as.numeric(Cl(GSPC)["2010/2014"])/as.numeric(Cl(GSPC)["2010/2014"][1]),col="green") legend("topleft", legend = c("1975-1979","1980-1989","1990-1999","2000-2009","2010-2014") , lty = 1, col = c("red","yellow","black","blue","green")) dev.off() library("PerformanceAnalytics") Cl(GSPC)["2010/2015"]/as.numeric(Cl(GSPC)["2005/2015"][1]) charts.PerformanceSummary(,main="",xlab="") # percent jpeg(filename = "SP500.jpg1975-1985-percent.jpg", width=880,height=880,res=100) plot(Cl(GSPC)["1975/1985"]/as.numeric(Cl(GSPC)["1975/1985"][1]),main="S&P 500 Index 1975-1985 (closing prices)") dev.off() jpeg(filename = "SP500.jpg1985-1995-percent.jpg", width=880,height=880,res=100) plot(Cl(GSPC)["1985/1995"]/as.numeric(Cl(GSPC)["1985/1995"][1]),main="S&P 500 Index 1985-1995 (closing prices)") dev.off() jpeg(filename = "SP500.jpg1995-2005-percent.jpg", width=880,height=880,res=100) plot(Cl(GSPC)["1995/2005"]/as.numeric(Cl(GSPC)["1995/2005"][1]),main="S&P 500 Index 1995-2005 (closing prices)") dev.off() jpeg(filename = "SP500.jpg2005-2015-percent.jpg", width=880,height=880,res=100) plot(Cl(GSPC)["2005/2015"]/as.numeric(Cl(GSPC)["2005/2015"][1]),main="S&P 500 Index 2005-2015 (closing prices)") dev.off() GSPC.cl.close <- diff(Cl(GSPC)) tail(GSPC.cl.close,20) jpeg(filename = "SP500-first-difference-example.jpg", width=880,height=880,res=100) plot(tail(GSPC.cl.close,200),main="S&P 500 first difference") dev.off() ## GSPC.cl.close.roc <- ROC(Cl(GSPC)) tail(GSPC.cl.close.roc,5) #prices <- Cl(GSPC) # ROC is log diff! #log_returns <- diff(log(prices), lag=1) #tail(log_returns) jpeg(filename = "SP500-first-roc-example.jpg", width=880,height=880,res=100) plot(tail(GSPC.cl.close.roc,200),main="S&P 500 first difference") dev.off() ## dax.roc <- na.omit(ROC(Cl(GSPC)))*100 plot(head(dax.roc,20)) plot(dax.roc) # standard if(abs(max(dax.roc))>abs(min(dax.roc))){ dax.roc.standard <- as.numeric(dax.roc/max(dax.roc)) }else{ dax.roc.standard <- as.numeric(dax.roc/abs(min(dax.roc))) } plot(dax.roc.standard,type="l") w<-dax.roc.standard f=41000 savewav(w,f=f ,filename = "xyz.wav") aw<-readWave("xyz.wav") play(aw) f=10000 savewav(w,f=f ,filename = "xyz.wav") aw<-readWave("xyz.wav") play(aw) f=5000 savewav(w,f=f ,filename = "xyz.wav") aw<-readWave("xyz.wav") play(aw) dax.roc <- as.numeric(dax.roc) dax.roc2 <- NULL for(i in 1:length(dax.roc)){ dax.roc2 <- rbind(dax.roc2,((dax.roc[i]+dax.roc[i+1])/2)) } lines <- NULL for(i in 1:length(dax.roc)){ line <- rbind(dax.roc[i],dax.roc2[i]) lines <- rbind(lines,line) } dax.roc <- na.omit(lines) tail(dax.roc) dax.roc <- na.omit(ROC(SMA(Cl(GSPC),n=500)))*100 dax.roc <- na.omit(ROC(Cl(GDAXI)))*100 dax.roc.standard <- as.numeric(dax.roc/max(dax.roc)) dax.roc.standard <- as.numeric(dax.roc/min(dax.roc)) hist(dax.roc.standard) w<-na.omit(SMA(dax.roc.standard,n=100)) w<-dax.roc.standard for(i in 1:5){ w<-c(w,w) } f=32000 savewav(w,f=f ,filename = "xyz.wav") aw<-readWave("xyz.wav") play(aw) # Martin Stoppacher # # office@martinstoppacher.com # # - - - - - - - - - - - - - - - - - - - - - - - - - - - - - - - - - - - - - - - # ################################################################################# |