## [1] "year"
## [2] "Access to clean fuels and technologies for cooking (% of population)"
## [3] "Access to electricity (% of population)"
## [4] "Access to electricity, rural (% of rural population)"
## [5] "Access to electricity, urban (% of urban population)"
## [6] "Account ownership at a financial institution or with a mobile-money-service provider (% of population ages 15+)"
## [7] "Account ownership at a financial institution or with a mobile-money-service provider, female (% of population ages 15+)"
## [8] "Account ownership at a financial institution or with a mobile-money-service provider, male (% of population ages 15+)"
## [9] "Account ownership at a financial institution or with a mobile-money-service provider, older adults (% of population ages 25+)"
## [10] "Account ownership at a financial institution or with a mobile-money-service provider, poorest 40% (% of population ages 15+)"
## [11] "Account ownership at a financial institution or with a mobile-money-service provider, primary education or less (% of population ages 15+)"
## [12] "Account ownership at a financial institution or with a mobile-money-service provider, richest 60% (% of population ages 15+)"
## [13] "Account ownership at a financial institution or with a mobile-money-service provider, secondary education or more (% of population ages 15+)"
## [14] "Account ownership at a financial institution or with a mobile-money-service provider, young adults (% of population ages 15-24)"
## [15] "Adequacy of social insurance programs (% of total welfare of beneficiary households)"
## [16] "Adequacy of social protection and labor programs (% of total welfare of beneficiary households)"
## [17] "Adequacy of social safety net programs (% of total welfare of beneficiary households)"
## [18] "Adjusted net enrollment rate, primary (% of primary school age children)"
## [19] "Adjusted net enrollment rate, primary, female (% of primary school age children)"
## [20] "Adjusted net enrollment rate, primary, male (% of primary school age children)"
## [21] "Adjusted net national income (constant 2010 US$)"
## [22] "Adjusted net national income (current US$)"
## [23] "Adjusted net national income per capita (constant 2010 US$)"
## [24] "Adjusted net national income per capita (current US$)"
## [25] "Adjusted net savings, excluding particulate emission damage (% of GNI)"
## [26] "Adjusted net savings, excluding particulate emission damage (current US$)"
## [27] "Adjusted net savings, including particulate emission damage (% of GNI)"
## [28] "Adjusted net savings, including particulate emission damage (current US$)"
## [29] "Adjusted savings: carbon dioxide damage (% of GNI)"
## [30] "Adjusted savings: carbon dioxide damage (current US$)"
## [31] "Adjusted savings: consumption of fixed capital (% of GNI)"
## [32] "Adjusted savings: consumption of fixed capital (current US$)"
## [33] "Adjusted savings: education expenditure (% of GNI)"
## [34] "Adjusted savings: education expenditure (current US$)"
## [35] "Adjusted savings: energy depletion (% of GNI)"
## [36] "Adjusted savings: energy depletion (current US$)"
## [37] "Adjusted savings: gross savings (% of GNI)"
## [38] "Adjusted savings: mineral depletion (% of GNI)"
## [39] "Adjusted savings: mineral depletion (current US$)"
## [40] "Adjusted savings: natural resources depletion (% of GNI)"
## [41] "Adjusted savings: net forest depletion (% of GNI)"
## [42] "Adjusted savings: net forest depletion (current US$)"
## [43] "Adjusted savings: net national savings (% of GNI)"
## [44] "Adjusted savings: net national savings (current US$)"
## [45] "Adjusted savings: particulate emission damage (% of GNI)"
## [46] "Adjusted savings: particulate emission damage (current US$)"
## [47] "Adolescent fertility rate (births per 1,000 women ages 15-19)"
## [48] "Adolescents out of school (% of lower secondary school age)"
## [49] "Adolescents out of school, female (% of female lower secondary school age)"
## [50] "Adolescents out of school, male (% of male lower secondary school age)"
## [51] "Adults (ages 15+) and children (ages 0-14) newly infected with HIV"
## [52] "Adults (ages 15+) newly infected with HIV"
## [53] "Age dependency ratio (% of working-age population)"
## [54] "Age dependency ratio, old (% of working-age population)"
## [55] "Age dependency ratio, young (% of working-age population)"
## [56] "Agricultural irrigated land (% of total agricultural land)"
## [57] "Agricultural land (% of land area)"
## [58] "Agricultural land (sq. km)"
## [59] "Agricultural machinery, tractors"
## [60] "Agricultural machinery, tractors per 100 sq. km of arable land"
## [61] "Agricultural methane emissions (% of total)"
## [62] "Agricultural methane emissions (thousand metric tons of CO2 equivalent)"
## [63] "Agricultural nitrous oxide emissions (% of total)"
## [64] "Agricultural nitrous oxide emissions (thousand metric tons of CO2 equivalent)"
## [65] "Agricultural raw materials exports (% of merchandise exports)"
## [66] "Agricultural raw materials imports (% of merchandise imports)"
## [67] "Agriculture, forestry, and fishing, value added (% of GDP)"
## [68] "Agriculture, forestry, and fishing, value added (annual % growth)"
## [69] "Agriculture, forestry, and fishing, value added (constant 2010 US$)"
## [70] "Agriculture, forestry, and fishing, value added (constant LCU)"
## [71] "Agriculture, forestry, and fishing, value added (current LCU)"
## [72] "Agriculture, forestry, and fishing, value added (current US$)"
## [73] "Agriculture, forestry, and fishing, value added per worker (constant 2010 US$)"
## [74] "Air transport, freight (million ton-km)"
## [75] "Air transport, passengers carried"
## [76] "Air transport, registered carrier departures worldwide"
## [77] "Annual freshwater withdrawals, agriculture (% of total freshwater withdrawal)"
## [78] "Annual freshwater withdrawals, domestic (% of total freshwater withdrawal)"
## [79] "Annual freshwater withdrawals, industry (% of total freshwater withdrawal)"
## [80] "Annual freshwater withdrawals, total (% of internal resources)"
## [81] "Annual freshwater withdrawals, total (billion cubic meters)"
## [82] "Antiretroviral therapy coverage (% of people living with HIV)"
## [83] "Antiretroviral therapy coverage for PMTCT (% of pregnant women living with HIV)"
## [84] "Aquaculture production (metric tons)"
## [85] "Arable land (% of land area)"
## [86] "Arable land (hectares per person)"
## [87] "Arable land (hectares)"
## [88] "ARI treatment (% of children under 5 taken to a health provider)"
## [89] "Armed forces personnel (% of total labor force)"
## [90] "Armed forces personnel, total"
## [91] "Arms exports (SIPRI trend indicator values)"
## [92] "Arms imports (SIPRI trend indicator values)"
## [93] "Automated teller machines (ATMs) (per 100,000 adults)"
## [94] "Average number of visits or required meetings with tax officials (for affected firms)"
## [95] "Average precipitation in depth (mm per year)"
## [96] "Average time to clear exports through customs (days)"
## [97] "Average transaction cost of sending remittances to a specific country (%)"
## [98] "Average working hours of children, study and work, ages 7-14 (hours per week)"
## [99] "Average working hours of children, study and work, female, ages 7-14 (hours per week)"
## [100] "Average working hours of children, study and work, male, ages 7-14 (hours per week)"
## [101] "Average working hours of children, working only, ages 7-14 (hours per week)"
## [102] "Average working hours of children, working only, female, ages 7-14 (hours per week)"
## [103] "Average working hours of children, working only, male, ages 7-14 (hours per week)"
## [104] "Bank capital to assets ratio (%)"
## [105] "Bank liquid reserves to bank assets ratio (%)"
## [106] "Bank nonperforming loans to total gross loans (%)"
## [107] "Battle-related deaths (number of people)"
## [108] "Benefit incidence of social insurance programs to poorest quintile (% of total social insurance benefits)"
## [109] "Benefit incidence of social protection and labor programs to poorest quintile (% of total SPL benefits)"
## [110] "Benefit incidence of social safety net programs to poorest quintile (% of total safety net benefits)"
## [111] "Binding coverage, all products (%)"
## [112] "Binding coverage, manufactured products (%)"
## [113] "Binding coverage, primary products (%)"
## [114] "Bird species, threatened"
## [115] "Birth rate, crude (per 1,000 people)"
## [116] "Births attended by skilled health staff (% of total)"
## [117] "Borrowers from commercial banks (per 1,000 adults)"
## [118] "Bound rate, simple mean, all products (%)"
## [119] "Bound rate, simple mean, manufactured products (%)"
## [120] "Bound rate, simple mean, primary products (%)"
## [121] "Bribery incidence (% of firms experiencing at least one bribe payment request)"
## [122] "Broad money (% of GDP)"
## [123] "Broad money (current LCU)"
## [124] "Broad money growth (annual %)"
## [125] "Broad money to total reserves ratio"
## [126] "Business extent of disclosure index (0=less disclosure to 10=more disclosure)"
## [127] "Capture fisheries production (metric tons)"
## [128] "Cause of death, by communicable diseases and maternal, prenatal and nutrition conditions (% of total)"
## [129] "Cause of death, by injury (% of total)"
## [130] "Cause of death, by non-communicable diseases (% of total)"
## [131] "Cereal production (metric tons)"
## [132] "Cereal yield (kg per hectare)"
## [133] "Charges for the use of intellectual property, payments (BoP, current US$)"
## [134] "Charges for the use of intellectual property, receipts (BoP, current US$)"
## [135] "Children (0-14) living with HIV"
## [136] "Children (ages 0-14) newly infected with HIV"
## [137] "Children in employment, female (% of female children ages 7-14)"
## [138] "Children in employment, male (% of male children ages 7-14)"
## [139] "Children in employment, study and work (% of children in employment, ages 7-14)"
## [140] "Children in employment, study and work, female (% of female children in employment, ages 7-14)"
## [141] "Children in employment, study and work, male (% of male children in employment, ages 7-14)"
## [142] "Children in employment, total (% of children ages 7-14)"
## [143] "Children in employment, unpaid family workers (% of children in employment, ages 7-14)"
## [144] "Children in employment, unpaid family workers, female (% of female children in employment, ages 7-14)"
## [145] "Children in employment, unpaid family workers, male (% of male children in employment, ages 7-14)"
## [146] "Children in employment, wage workers (% of children in employment, ages 7-14)"
## [147] "Children in employment, wage workers, female (% of female children in employment, ages 7-14)"
## [148] "Children in employment, wage workers, male (% of male children in employment, ages 7-14)"
## [149] "Children in employment, work only (% of children in employment, ages 7-14)"
## [150] "Children in employment, work only, female (% of female children in employment, ages 7-14)"
## [151] "Children in employment, work only, male (% of male children in employment, ages 7-14)"
## [152] "Children out of school (% of primary school age)"
## [153] "Children out of school, female (% of female primary school age)"
## [154] "Children out of school, male (% of male primary school age)"
## [155] "Children out of school, primary"
## [156] "Children out of school, primary, female"
## [157] "Children out of school, primary, male"
## [158] "Children with fever receiving antimalarial drugs (% of children under age 5 with fever)"
## [159] "Claims on central government (annual growth as % of broad money)"
## [160] "Claims on central government, etc. (% GDP)"
## [161] "Claims on other sectors of the domestic economy (annual growth as % of broad money)"
## [162] "Claims on private sector (annual growth as % of broad money)"
## [163] "CO2 emissions (kg per 2010 US$ of GDP)"
## [164] "CO2 emissions (kg per 2017 PPP $ of GDP)"
## [165] "CO2 emissions (kg per PPP $ of GDP)"
## [166] "CO2 emissions (kt)"
## [167] "CO2 emissions (metric tons per capita)"
## [168] "CO2 emissions from gaseous fuel consumption (% of total)"
## [169] "CO2 emissions from gaseous fuel consumption (kt)"
## [170] "CO2 emissions from liquid fuel consumption (% of total)"
## [171] "CO2 emissions from liquid fuel consumption (kt)"
## [172] "CO2 emissions from solid fuel consumption (% of total)"
## [173] "CO2 emissions from solid fuel consumption (kt)"
## [174] "Coal rents (% of GDP)"
## [175] "Commercial bank branches (per 100,000 adults)"
## [176] "Commercial banks and other lending (PPG + PNG) (NFL, current US$)"
## [177] "Commercial service exports (current US$)"
## [178] "Commercial service imports (current US$)"
## [179] "Communications, computer, etc. (% of service exports, BoP)"
## [180] "Communications, computer, etc. (% of service imports, BoP)"
## [181] "Compensation of employees (% of expense)"
## [182] "Compensation of employees (current LCU)"
## [183] "Completeness of birth registration (%)"
## [184] "Completeness of birth registration, female (%)"
## [185] "Completeness of birth registration, male (%)"
## [186] "Completeness of birth registration, rural (%)"
## [187] "Completeness of birth registration, urban (%)"
## [188] "Compulsory education, duration (years)"
## [189] "Computer, communications and other services (% of commercial service exports)"
## [190] "Computer, communications and other services (% of commercial service imports)"
## [191] "Consumer price index (2010 = 100)"
## [192] "Consumption of iodized salt (% of households)"
## [193] "Contraceptive prevalence, any methods (% of women ages 15-49)"
## [194] "Contraceptive prevalence, modern methods (% of women ages 15-49)"
## [195] "Contributing family workers, female (% of female employment) (modeled ILO estimate)"
## [196] "Contributing family workers, male (% of male employment) (modeled ILO estimate)"
## [197] "Contributing family workers, total (% of total employment) (modeled ILO estimate)"
## [198] "Cost of business start-up procedures (% of GNI per capita)"
## [199] "Cost of business start-up procedures, female (% of GNI per capita)"
## [200] "Cost of business start-up procedures, male (% of GNI per capita)"
## [201] "Cost to export, border compliance (US$)"
## [202] "Cost to export, documentary compliance (US$)"
## [203] "Cost to import, border compliance (US$)"
## [204] "Cost to import, documentary compliance (US$)"
## [205] "Coverage of social insurance programs (% of population)"
## [206] "Coverage of social insurance programs in 2nd quintile (% of population)"
## [207] "Coverage of social insurance programs in 3rd quintile (% of population)"
## [208] "Coverage of social insurance programs in 4th quintile (% of population)"
## [209] "Coverage of social insurance programs in poorest quintile (% of population)"
## [210] "Coverage of social insurance programs in richest quintile (% of population)"
## [211] "Coverage of social protection and labor programs (% of population)"
## [212] "Coverage of social safety net programs (% of population)"
## [213] "Coverage of social safety net programs in 2nd quintile (% of population)"
## [214] "Coverage of social safety net programs in 3rd quintile (% of population)"
## [215] "Coverage of social safety net programs in 4th quintile (% of population)"
## [216] "Coverage of social safety net programs in poorest quintile (% of population)"
## [217] "Coverage of social safety net programs in richest quintile (% of population)"
## [218] "CPIA building human resources rating (1=low to 6=high)"
## [219] "CPIA business regulatory environment rating (1=low to 6=high)"
## [220] "CPIA debt policy rating (1=low to 6=high)"
## [221] "CPIA economic management cluster average (1=low to 6=high)"
## [222] "CPIA efficiency of revenue mobilization rating (1=low to 6=high)"
## [223] "CPIA equity of public resource use rating (1=low to 6=high)"
## [224] "CPIA financial sector rating (1=low to 6=high)"
## [225] "CPIA fiscal policy rating (1=low to 6=high)"
## [226] "CPIA gender equality rating (1=low to 6=high)"
## [227] "CPIA macroeconomic management rating (1=low to 6=high)"
## [228] "CPIA policies for social inclusion/equity cluster average (1=low to 6=high)"
## [229] "CPIA policy and institutions for environmental sustainability rating (1=low to 6=high)"
## [230] "CPIA property rights and rule-based governance rating (1=low to 6=high)"
## [231] "CPIA public sector management and institutions cluster average (1=low to 6=high)"
## [232] "CPIA quality of budgetary and financial management rating (1=low to 6=high)"
## [233] "CPIA quality of public administration rating (1=low to 6=high)"
## [234] "CPIA social protection rating (1=low to 6=high)"
## [235] "CPIA structural policies cluster average (1=low to 6=high)"
## [236] "CPIA trade rating (1=low to 6=high)"
## [237] "CPIA transparency, accountability, and corruption in the public sector rating (1=low to 6=high)"
## [238] "Crop production index (2004-2006 = 100)"
## [239] "Current account balance (% of GDP)"
## [240] "Current account balance (BoP, current US$)"
## [241] "Current education expenditure, primary (% of total expenditure in primary public institutions)"
## [242] "Current education expenditure, secondary (% of total expenditure in secondary public institutions)"
## [243] "Current education expenditure, tertiary (% of total expenditure in tertiary public institutions)"
## [244] "Current education expenditure, total (% of total expenditure in public institutions)"
## [245] "Current health expenditure (% of GDP)"
## [246] "Current health expenditure per capita (current US$)"
## [247] "Current health expenditure per capita, PPP (current international $)"
## [248] "Customs and other import duties (% of tax revenue)"
## [249] "Customs and other import duties (current LCU)"
## [250] "Death rate, crude (per 1,000 people)"
## [251] "Debt service (PPG and IMF only, % of exports of goods, services and primary income)"
## [252] "Debt service on external debt, public and publicly guaranteed (PPG) (TDS, current US$)"
## [253] "Debt service on external debt, total (TDS, current US$)"
## [254] "DEC alternative conversion factor (LCU per US$)"
## [255] "Demand for family planning satisfied by modern methods (% of married women with demand for family planning)"
## [256] "Depositors with commercial banks (per 1,000 adults)"
## [257] "Depth of credit information index (0=low to 8=high)"
## [258] "Diabetes prevalence (% of population ages 20 to 79)"
## [259] "Diarrhea treatment (% of children under 5 receiving oral rehydration and continued feeding)"
## [260] "Diarrhea treatment (% of children under 5 who received ORS packet)"
## [261] "Discrepancy in expenditure estimate of GDP (current LCU)"
## [262] "Domestic credit to private sector (% of GDP)"
## [263] "Domestic credit to private sector by banks (% of GDP)"
## [264] "Domestic general government health expenditure (% of current health expenditure)"
## [265] "Domestic general government health expenditure (% of GDP)"
## [266] "Domestic general government health expenditure (% of general government expenditure)"
## [267] "Domestic general government health expenditure per capita (current US$)"
## [268] "Domestic general government health expenditure per capita, PPP (current international $)"
## [269] "Domestic private health expenditure (% of current health expenditure)"
## [270] "Domestic private health expenditure per capita (current US$)"
## [271] "Domestic private health expenditure per capita, PPP (current international $)"
## [272] "Droughts, floods, extreme temperatures (% of population, average 1990-2009)"
## [273] "Ease of doing business index (1=most business-friendly regulations)"
## [274] "Ease of doing business score (0 = lowest performance to 100 = best performance)"
## [275] "Educational attainment, at least completed lower secondary, population 25+, female (%) (cumulative)"
## [276] "Educational attainment, at least completed lower secondary, population 25+, male (%) (cumulative)"
## [277] "Educational attainment, at least completed lower secondary, population 25+, total (%) (cumulative)"
## [278] "Educational attainment, at least completed post-secondary, population 25+, female (%) (cumulative)"
## [279] "Educational attainment, at least completed post-secondary, population 25+, male (%) (cumulative)"
## [280] "Educational attainment, at least completed post-secondary, population 25+, total (%) (cumulative)"
## [281] "Educational attainment, at least completed primary, population 25+ years, female (%) (cumulative)"
## [282] "Educational attainment, at least completed primary, population 25+ years, male (%) (cumulative)"
## [283] "Educational attainment, at least completed primary, population 25+ years, total (%) (cumulative)"
## [284] "Educational attainment, at least completed upper secondary, population 25+, female (%) (cumulative)"
## [285] "Educational attainment, at least completed upper secondary, population 25+, male (%) (cumulative)"
## [286] "Educational attainment, at least completed upper secondary, population 25+, total (%) (cumulative)"
## [287] "Employers, female (% of female employment) (modeled ILO estimate)"
## [288] "Employers, male (% of male employment) (modeled ILO estimate)"
## [289] "Employers, total (% of total employment) (modeled ILO estimate)"
## [290] "Employment in agriculture (% of total employment) (modeled ILO estimate)"
## [291] "Employment in agriculture, female (% of female employment) (modeled ILO estimate)"
## [292] "Employment in agriculture, male (% of male employment) (modeled ILO estimate)"
## [293] "Employment in industry (% of total employment) (modeled ILO estimate)"
## [294] "Employment in industry, female (% of female employment) (modeled ILO estimate)"
## [295] "Employment in industry, male (% of male employment) (modeled ILO estimate)"
## [296] "Employment in services (% of total employment) (modeled ILO estimate)"
## [297] "Employment in services, female (% of female employment) (modeled ILO estimate)"
## [298] "Employment in services, male (% of male employment) (modeled ILO estimate)"
## [299] "Employment to population ratio, 15+, female (%) (modeled ILO estimate)"
## [300] "Employment to population ratio, 15+, female (%) (national estimate)"
## [301] "Employment to population ratio, 15+, male (%) (modeled ILO estimate)"
## [302] "Employment to population ratio, 15+, male (%) (national estimate)"
## [303] "Employment to population ratio, 15+, total (%) (modeled ILO estimate)"
## [304] "Employment to population ratio, 15+, total (%) (national estimate)"
## [305] "Employment to population ratio, ages 15-24, female (%) (modeled ILO estimate)"
## [306] "Employment to population ratio, ages 15-24, female (%) (national estimate)"
## [307] "Employment to population ratio, ages 15-24, male (%) (modeled ILO estimate)"
## [308] "Employment to population ratio, ages 15-24, male (%) (national estimate)"
## [309] "Employment to population ratio, ages 15-24, total (%) (modeled ILO estimate)"
## [310] "Employment to population ratio, ages 15-24, total (%) (national estimate)"
## [311] "Energy intensity level of primary energy (MJ/$2011 PPP GDP)"
## [312] "Energy related methane emissions (% of total)"
## [313] "Exclusive breastfeeding (% of children under 6 months)"
## [314] "Expenditure on primary education (% of government expenditure on education)"
## [315] "Expenditure on secondary education (% of government expenditure on education)"
## [316] "Expenditure on tertiary education (% of government expenditure on education)"
## [317] "Expense (% of GDP)"
## [318] "Expense (current LCU)"
## [319] "Export unit value index (2000 = 100)"
## [320] "Export value index (2000 = 100)"
## [321] "Export volume index (2000 = 100)"
## [322] "Exports of goods and services (% of GDP)"
## [323] "Exports of goods and services (BoP, current US$)"
## [324] "Exports of goods and services (constant 2010 US$)"
## [325] "Exports of goods and services (current LCU)"
## [326] "Exports of goods and services (current US$)"
## [327] "Exports of goods, services and primary income (BoP, current US$)"
## [328] "External balance on goods and services (% of GDP)"
## [329] "External balance on goods and services (current LCU)"
## [330] "External balance on goods and services (current US$)"
## [331] "External debt stocks (% of GNI)"
## [332] "External debt stocks, long-term (DOD, current US$)"
## [333] "External debt stocks, private nonguaranteed (PNG) (DOD, current US$)"
## [334] "External debt stocks, public and publicly guaranteed (PPG) (DOD, current US$)"
## [335] "External debt stocks, short-term (DOD, current US$)"
## [336] "External debt stocks, total (DOD, current US$)"
## [337] "External health expenditure (% of current health expenditure)"
## [338] "External health expenditure per capita (current US$)"
## [339] "External health expenditure per capita, PPP (current international $)"
## [340] "Female headed households (% of households with a female head)"
## [341] "Female share of employment in senior and middle management (%)"
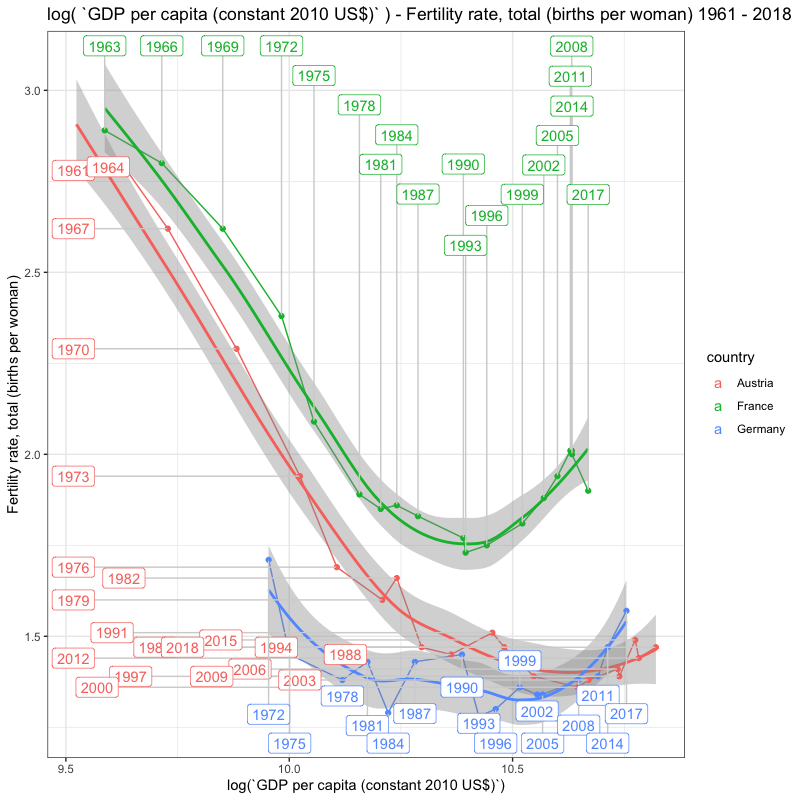
## [342] "Fertility rate, total (births per woman)"
## [343] "Fertilizer consumption (% of fertilizer production)"
## [344] "Fertilizer consumption (kilograms per hectare of arable land)"
## [345] "Final consumption expenditure (% of GDP)"
## [346] "Final consumption expenditure (constant 2010 US$)"
## [347] "Final consumption expenditure (current LCU)"
## [348] "Final consumption expenditure (current US$)"
## [349] "Firms competing against unregistered firms (% of firms)"
## [350] "Firms expected to give gifts in meetings with tax officials (% of firms)"
## [351] "Firms experiencing electrical outages (% of firms)"
## [352] "Firms experiencing losses due to theft and vandalism (% of firms)"
## [353] "Firms formally registered when operations started (% of firms)"
## [354] "Firms offering formal training (% of firms)"
## [355] "Firms that spend on R&D (% of firms)"
## [356] "Firms using banks to finance investment (% of firms)"
## [357] "Firms using banks to finance working capital (% of firms)"
## [358] "Firms visited or required meetings with tax officials (% of firms)"
## [359] "Firms with female participation in ownership (% of firms)"
## [360] "Firms with female top manager (% of firms)"
## [361] "Fish species, threatened"
## [362] "Fixed broadband subscriptions"
## [363] "Fixed broadband subscriptions (per 100 people)"
## [364] "Fixed telephone subscriptions"
## [365] "Fixed telephone subscriptions (per 100 people)"
## [366] "Food exports (% of merchandise exports)"
## [367] "Food imports (% of merchandise imports)"
## [368] "Food production index (2004-2006 = 100)"
## [369] "Foreign direct investment, net (BoP, current US$)"
## [370] "Foreign direct investment, net inflows (% of GDP)"
## [371] "Foreign direct investment, net inflows (BoP, current US$)"
## [372] "Foreign direct investment, net outflows (% of GDP)"
## [373] "Foreign direct investment, net outflows (BoP, current US$)"
## [374] "Forest area (% of land area)"
## [375] "Forest area (sq. km)"
## [376] "Forest rents (% of GDP)"
## [377] "Fuel exports (% of merchandise exports)"
## [378] "Fuel imports (% of merchandise imports)"
## [379] "GDP (constant 2010 US$)"
## [380] "GDP (constant LCU)"
## [381] "GDP (current LCU)"
## [382] "GDP (current US$)"
## [383] "GDP deflator (base year varies by country)"
## [384] "GDP deflator: linked series (base year varies by country)"
## [385] "GDP growth (annual %)"
## [386] "GDP per capita (constant 2010 US$)"
## [387] "GDP per capita (constant LCU)"
## [388] "GDP per capita (current LCU)"
## [389] "GDP per capita (current US$)"
## [390] "GDP per capita growth (annual %)"
## [391] "GDP per capita, PPP (constant 2017 international $)"
## [392] "GDP per capita, PPP (current international $)"
## [393] "GDP per person employed (constant 2017 PPP $)"
## [394] "GDP, PPP (constant 2017 international $)"
## [395] "GDP, PPP (current international $)"
## [396] "GDP: linked series (current LCU)"
## [397] "General government final consumption expenditure (% of GDP)"
## [398] "General government final consumption expenditure (constant 2010 US$)"
## [399] "General government final consumption expenditure (current LCU)"
## [400] "General government final consumption expenditure (current US$)"
## [401] "GNI (constant 2010 US$)"
## [402] "GNI (current LCU)"
## [403] "GNI (current US$)"
## [404] "GNI per capita (constant 2010 US$)"
## [405] "GNI per capita (current LCU)"
## [406] "GNI per capita, Atlas method (current US$)"
## [407] "GNI per capita, PPP (constant 2017 international $)"
## [408] "GNI per capita, PPP (current international $)"
## [409] "GNI, Atlas method (current US$)"
## [410] "GNI, PPP (constant 2017 international $)"
## [411] "GNI, PPP (current international $)"
## [412] "GNI: linked series (current LCU)"
## [413] "Goods and services expense (% of expense)"
## [414] "Goods and services expense (current LCU)"
## [415] "Goods exports (BoP, current US$)"
## [416] "Goods imports (BoP, current US$)"
## [417] "Government expenditure on education, total (% of GDP)"
## [418] "Government expenditure on education, total (% of government expenditure)"
## [419] "Government expenditure per student, primary (% of GDP per capita)"
## [420] "Government expenditure per student, secondary (% of GDP per capita)"
## [421] "Government expenditure per student, tertiary (% of GDP per capita)"
## [422] "Grants and other revenue (% of revenue)"
## [423] "Grants and other revenue (current LCU)"
## [424] "Grants, excluding technical cooperation (BoP, current US$)"
## [425] "Gross capital formation (% of GDP)"
## [426] "Gross capital formation (constant 2010 US$)"
## [427] "Gross capital formation (current LCU)"
## [428] "Gross capital formation (current US$)"
## [429] "Gross domestic savings (% of GDP)"
## [430] "Gross domestic savings (current LCU)"
## [431] "Gross domestic savings (current US$)"
## [432] "Gross fixed capital formation (% of GDP)"
## [433] "Gross fixed capital formation (constant 2010 US$)"
## [434] "Gross fixed capital formation (current LCU)"
## [435] "Gross fixed capital formation (current US$)"
## [436] "Gross intake ratio in first grade of primary education, female (% of relevant age group)"
## [437] "Gross intake ratio in first grade of primary education, male (% of relevant age group)"
## [438] "Gross intake ratio in first grade of primary education, total (% of relevant age group)"
## [439] "Gross national expenditure (% of GDP)"
## [440] "Gross national expenditure (constant 2010 US$)"
## [441] "Gross national expenditure (current LCU)"
## [442] "Gross national expenditure (current US$)"
## [443] "Gross savings (% of GDP)"
## [444] "Gross savings (% of GNI)"
## [445] "Gross savings (current LCU)"
## [446] "Gross savings (current US$)"
## [447] "Gross value added at basic prices (GVA) (constant 2010 US$)"
## [448] "Gross value added at basic prices (GVA) (constant LCU)"
## [449] "Gross value added at basic prices (GVA) (current LCU)"
## [450] "Gross value added at basic prices (GVA) (current US$)"
## [451] "Hospital beds (per 1,000 people)"
## [452] "Households and NPISHs final consumption expenditure (% of GDP)"
## [453] "Households and NPISHs Final consumption expenditure (constant 2010 US$)"
## [454] "Households and NPISHs Final consumption expenditure (current LCU)"
## [455] "Households and NPISHs Final consumption expenditure (current US$)"
## [456] "Households and NPISHs Final consumption expenditure per capita (constant 2010 US$)"
## [457] "Households and NPISHs Final consumption expenditure, PPP (constant 2017 international $)"
## [458] "Households and NPISHs Final consumption expenditure, PPP (current international $)"
## [459] "Households and NPISHs final consumption expenditure: linked series (current LCU)"
## [460] "Human capital index (HCI) (scale 0-1)"
## [461] "Human capital index (HCI), female (scale 0-1)"
## [462] "Human capital index (HCI), female, lower bound (scale 0-1)"
## [463] "Human capital index (HCI), female, upper bound (scale 0-1)"
## [464] "Human capital index (HCI), lower bound (scale 0-1)"
## [465] "Human capital index (HCI), male (scale 0-1)"
## [466] "Human capital index (HCI), male, lower bound (scale 0-1)"
## [467] "Human capital index (HCI), male, upper bound (scale 0-1)"
## [468] "Human capital index (HCI), upper bound (scale 0-1)"
## [469] "IBRD loans and IDA credits (DOD, current US$)"
## [470] "ICT goods imports (% total goods imports)"
## [471] "ICT service exports (% of service exports, BoP)"
## [472] "ICT service exports (BoP, current US$)"
## [473] "IDA resource allocation index (1=low to 6=high)"
## [474] "IFC, private nonguaranteed (NFL, current US$)"
## [475] "IMF repurchases and charges (TDS, current US$)"
## [476] "Immunization, DPT (% of children ages 12-23 months)"
## [477] "Immunization, HepB3 (% of one-year-old children)"
## [478] "Immunization, measles (% of children ages 12-23 months)"
## [479] "Import unit value index (2000 = 100)"
## [480] "Import value index (2000 = 100)"
## [481] "Import volume index (2000 = 100)"
## [482] "Imports of goods and services (% of GDP)"
## [483] "Imports of goods and services (BoP, current US$)"
## [484] "Imports of goods and services (constant 2010 US$)"
## [485] "Imports of goods and services (current LCU)"
## [486] "Imports of goods and services (current US$)"
## [487] "Imports of goods, services and primary income (BoP, current US$)"
## [488] "Incidence of HIV (per 1,000 uninfected population ages 15-49)"
## [489] "Incidence of malaria (per 1,000 population at risk)"
## [490] "Incidence of tuberculosis (per 100,000 people)"
## [491] "Increase in poverty gap at $1.90 ($ 2011 PPP) poverty line due to out-of-pocket health care expenditure (% of poverty line)"
## [492] "Increase in poverty gap at $1.90 ($ 2011 PPP) poverty line due to out-of-pocket health care expenditure (USD)"
## [493] "Increase in poverty gap at $3.20 ($ 2011 PPP) poverty line due to out-of-pocket health care expenditure (% of poverty line)"
## [494] "Increase in poverty gap at $3.20 ($ 2011 PPP) poverty line due to out-of-pocket health care expenditure (USD)"
## [495] "Individuals using the Internet (% of population)"
## [496] "Industry (including construction), value added (% of GDP)"
## [497] "Industry (including construction), value added (annual % growth)"
## [498] "Industry (including construction), value added (constant 2010 US$)"
## [499] "Industry (including construction), value added (constant LCU)"
## [500] "Industry (including construction), value added (current LCU)"
## [501] "Industry (including construction), value added (current US$)"
## [502] "Industry (including construction), value added per worker (constant 2010 US$)"
## [503] "Inflation, consumer prices (annual %)"
## [504] "Inflation, GDP deflator (annual %)"
## [505] "Inflation, GDP deflator: linked series (annual %)"
## [506] "Informal payments to public officials (% of firms)"
## [507] "Insurance and financial services (% of commercial service exports)"
## [508] "Insurance and financial services (% of commercial service imports)"
## [509] "Insurance and financial services (% of service exports, BoP)"
## [510] "Insurance and financial services (% of service imports, BoP)"
## [511] "Intentional homicides (per 100,000 people)"
## [512] "Interest payments (% of expense)"
## [513] "Interest payments (% of revenue)"
## [514] "Interest payments (current LCU)"
## [515] "Internally displaced persons, new displacement associated with conflict and violence (number of cases)"
## [516] "Internally displaced persons, new displacement associated with disasters (number of cases)"
## [517] "Internally displaced persons, total displaced by conflict and violence (number of people)"
## [518] "International migrant stock (% of population)"
## [519] "International migrant stock, total"
## [520] "International tourism, expenditures (% of total imports)"
## [521] "International tourism, expenditures (current US$)"
## [522] "International tourism, expenditures for passenger transport items (current US$)"
## [523] "International tourism, expenditures for travel items (current US$)"
## [524] "International tourism, receipts (% of total exports)"
## [525] "International tourism, receipts (current US$)"
## [526] "International tourism, receipts for passenger transport items (current US$)"
## [527] "International tourism, receipts for travel items (current US$)"
## [528] "Investment in energy with private participation (current US$)"
## [529] "Labor force participation rate for ages 15-24, female (%) (modeled ILO estimate)"
## [530] "Labor force participation rate for ages 15-24, female (%) (national estimate)"
## [531] "Labor force participation rate for ages 15-24, male (%) (modeled ILO estimate)"
## [532] "Labor force participation rate for ages 15-24, male (%) (national estimate)"
## [533] "Labor force participation rate for ages 15-24, total (%) (modeled ILO estimate)"
## [534] "Labor force participation rate for ages 15-24, total (%) (national estimate)"
## [535] "Labor force participation rate, female (% of female population ages 15-64) (modeled ILO estimate)"
## [536] "Labor force participation rate, female (% of female population ages 15+) (modeled ILO estimate)"
## [537] "Labor force participation rate, female (% of female population ages 15+) (national estimate)"
## [538] "Labor force participation rate, male (% of male population ages 15-64) (modeled ILO estimate)"
## [539] "Labor force participation rate, male (% of male population ages 15+) (modeled ILO estimate)"
## [540] "Labor force participation rate, male (% of male population ages 15+) (national estimate)"
## [541] "Labor force participation rate, total (% of total population ages 15-64) (modeled ILO estimate)"
## [542] "Labor force participation rate, total (% of total population ages 15+) (modeled ILO estimate)"
## [543] "Labor force participation rate, total (% of total population ages 15+) (national estimate)"
## [544] "Labor force with advanced education (% of total working-age population with advanced education)"
## [545] "Labor force with advanced education, female (% of female working-age population with advanced education)"
## [546] "Labor force with advanced education, male (% of male working-age population with advanced education)"
## [547] "Labor force with basic education (% of total working-age population with basic education)"
## [548] "Labor force with basic education, female (% of female working-age population with basic education)"
## [549] "Labor force with basic education, male (% of male working-age population with basic education)"
## [550] "Labor force with intermediate education (% of total working-age population with intermediate education)"
## [551] "Labor force with intermediate education, female (% of female working-age population with intermediate education)"
## [552] "Labor force with intermediate education, male (% of male working-age population with intermediate education)"
## [553] "Labor force, female (% of total labor force)"
## [554] "Labor force, total"
## [555] "Labor tax and contributions (% of commercial profits)"
## [556] "Land area (sq. km)"
## [557] "Land under cereal production (hectares)"
## [558] "Lead time to export, median case (days)"
## [559] "Lead time to import, median case (days)"
## [560] "Lending interest rate (%)"
## [561] "Level of water stress: freshwater withdrawal as a proportion of available freshwater resources"
## [562] "Life expectancy at birth, female (years)"
## [563] "Life expectancy at birth, male (years)"
## [564] "Life expectancy at birth, total (years)"
## [565] "Lifetime risk of maternal death (%)"
## [566] "Lifetime risk of maternal death (1 in: rate varies by country)"
## [567] "Literacy rate, adult female (% of females ages 15 and above)"
## [568] "Literacy rate, adult male (% of males ages 15 and above)"
## [569] "Literacy rate, adult total (% of people ages 15 and above)"
## [570] "Literacy rate, youth (ages 15-24), gender parity index (GPI)"
## [571] "Literacy rate, youth female (% of females ages 15-24)"
## [572] "Literacy rate, youth male (% of males ages 15-24)"
## [573] "Literacy rate, youth total (% of people ages 15-24)"
## [574] "Livestock production index (2004-2006 = 100)"
## [575] "Logistics performance index: Ability to track and trace consignments (1=low to 5=high)"
## [576] "Logistics performance index: Competence and quality of logistics services (1=low to 5=high)"
## [577] "Logistics performance index: Ease of arranging competitively priced shipments (1=low to 5=high)"
## [578] "Logistics performance index: Efficiency of customs clearance process (1=low to 5=high)"
## [579] "Logistics performance index: Frequency with which shipments reach consignee within scheduled or expected time (1=low to 5=high)"
## [580] "Logistics performance index: Overall (1=low to 5=high)"
## [581] "Logistics performance index: Quality of trade and transport-related infrastructure (1=low to 5=high)"
## [582] "Losses due to theft and vandalism (% of annual sales of affected firms)"
## [583] "Lower secondary completion rate, female (% of relevant age group)"
## [584] "Lower secondary completion rate, male (% of relevant age group)"
## [585] "Lower secondary completion rate, total (% of relevant age group)"
## [586] "Lower secondary school starting age (years)"
## [587] "Mammal species, threatened"
## [588] "Manufactures exports (% of merchandise exports)"
## [589] "Manufactures imports (% of merchandise imports)"
## [590] "Manufacturing, value added (% of GDP)"
## [591] "Manufacturing, value added (annual % growth)"
## [592] "Manufacturing, value added (constant 2010 US$)"
## [593] "Manufacturing, value added (constant LCU)"
## [594] "Manufacturing, value added (current LCU)"
## [595] "Manufacturing, value added (current US$)"
## [596] "Maternal mortality ratio (modeled estimate, per 100,000 live births)"
## [597] "Maternal mortality ratio (national estimate, per 100,000 live births)"
## [598] "Medium and high-tech exports (% manufactured exports)"
## [599] "Medium and high-tech Industry (including construction) (% manufacturing value added)"
## [600] "Merchandise exports (current US$)"
## [601] "Merchandise exports by the reporting economy (current US$)"
## [602] "Merchandise exports by the reporting economy, residual (% of total merchandise exports)"
## [603] "Merchandise exports to economies in the Arab World (% of total merchandise exports)"
## [604] "Merchandise exports to high-income economies (% of total merchandise exports)"
## [605] "Merchandise exports to low- and middle-income economies in East Asia & Pacific (% of total merchandise exports)"
## [606] "Merchandise exports to low- and middle-income economies in Europe & Central Asia (% of total merchandise exports)"
## [607] "Merchandise exports to low- and middle-income economies in Latin America & the Caribbean (% of total merchandise exports)"
## [608] "Merchandise exports to low- and middle-income economies in Middle East & North Africa (% of total merchandise exports)"
## [609] "Merchandise exports to low- and middle-income economies in South Asia (% of total merchandise exports)"
## [610] "Merchandise exports to low- and middle-income economies in Sub-Saharan Africa (% of total merchandise exports)"
## [611] "Merchandise exports to low- and middle-income economies outside region (% of total merchandise exports)"
## [612] "Merchandise exports to low- and middle-income economies within region (% of total merchandise exports)"
## [613] "Merchandise imports (current US$)"
## [614] "Merchandise imports by the reporting economy (current US$)"
## [615] "Merchandise imports by the reporting economy, residual (% of total merchandise imports)"
## [616] "Merchandise imports from economies in the Arab World (% of total merchandise imports)"
## [617] "Merchandise imports from high-income economies (% of total merchandise imports)"
## [618] "Merchandise imports from low- and middle-income economies in East Asia & Pacific (% of total merchandise imports)"
## [619] "Merchandise imports from low- and middle-income economies in Europe & Central Asia (% of total merchandise imports)"
## [620] "Merchandise imports from low- and middle-income economies in Latin America & the Caribbean (% of total merchandise imports)"
## [621] "Merchandise imports from low- and middle-income economies in Middle East & North Africa (% of total merchandise imports)"
## [622] "Merchandise imports from low- and middle-income economies in South Asia (% of total merchandise imports)"
## [623] "Merchandise imports from low- and middle-income economies in Sub-Saharan Africa (% of total merchandise imports)"
## [624] "Merchandise imports from low- and middle-income economies outside region (% of total merchandise imports)"
## [625] "Merchandise imports from low- and middle-income economies within region (% of total merchandise imports)"
## [626] "Merchandise trade (% of GDP)"
## [627] "Methane emissions (% change from 1990)"
## [628] "Methane emissions (kt of CO2 equivalent)"
## [629] "Methane emissions in energy sector (thousand metric tons of CO2 equivalent)"
## [630] "Methodology assessment of statistical capacity (scale 0 - 100)"
## [631] "Military expenditure (% of GDP)"
## [632] "Military expenditure (% of general government expenditure)"
## [633] "Military expenditure (current LCU)"
## [634] "Military expenditure (current USD)"
## [635] "Mineral rents (% of GDP)"
## [636] "Mobile cellular subscriptions"
## [637] "Mobile cellular subscriptions (per 100 people)"
## [638] "Monetary Sector credit to private sector (% GDP)"
## [639] "Mortality caused by road traffic injury (per 100,000 people)"
## [640] "Mortality from CVD, cancer, diabetes or CRD between exact ages 30 and 70 (%)"
## [641] "Mortality from CVD, cancer, diabetes or CRD between exact ages 30 and 70, female (%)"
## [642] "Mortality from CVD, cancer, diabetes or CRD between exact ages 30 and 70, male (%)"
## [643] "Mortality rate attributed to household and ambient air pollution, age-standardized (per 100,000 population)"
## [644] "Mortality rate attributed to household and ambient air pollution, age-standardized, female (per 100,000 female population)"
## [645] "Mortality rate attributed to household and ambient air pollution, age-standardized, male (per 100,000 male population)"
## [646] "Mortality rate attributed to unintentional poisoning (per 100,000 population)"
## [647] "Mortality rate attributed to unintentional poisoning, female (per 100,000 female population)"
## [648] "Mortality rate attributed to unintentional poisoning, male (per 100,000 male population)"
## [649] "Mortality rate attributed to unsafe water, unsafe sanitation and lack of hygiene (per 100,000 population)"
## [650] "Mortality rate, adult, female (per 1,000 female adults)"
## [651] "Mortality rate, adult, male (per 1,000 male adults)"
## [652] "Mortality rate, infant (per 1,000 live births)"
## [653] "Mortality rate, infant, female (per 1,000 live births)"
## [654] "Mortality rate, infant, male (per 1,000 live births)"
## [655] "Mortality rate, neonatal (per 1,000 live births)"
## [656] "Mortality rate, under-5 (per 1,000 live births)"
## [657] "Mortality rate, under-5, female (per 1,000 live births)"
## [658] "Mortality rate, under-5, male (per 1,000 live births)"
## [659] "Multidimensional poverty headcount ratio (% of total population)"
## [660] "Multidimensional poverty headcount ratio, children (% of population ages 0-17)"
## [661] "Multidimensional poverty index (scale 0-1)"
## [662] "Multidimensional poverty index, children (population ages 0-17) (scale 0-1)"
## [663] "Multidimensional poverty intensity (average share of deprivations experienced by the poor)"
## [664] "Multilateral debt service (% of public and publicly guaranteed debt service)"
## [665] "Multilateral debt service (TDS, current US$)"
## [666] "Natural gas rents (% of GDP)"
## [667] "Net acquisition of financial assets (% of GDP)"
## [668] "Net acquisition of financial assets (current LCU)"
## [669] "Net barter terms of trade index (2000 = 100)"
## [670] "Net bilateral aid flows from DAC donors, Australia (current US$)"
## [671] "Net bilateral aid flows from DAC donors, Austria (current US$)"
## [672] "Net bilateral aid flows from DAC donors, Belgium (current US$)"
## [673] "Net bilateral aid flows from DAC donors, Canada (current US$)"
## [674] "Net bilateral aid flows from DAC donors, Czech Republic (current US$)"
## [675] "Net bilateral aid flows from DAC donors, Denmark (current US$)"
## [676] "Net bilateral aid flows from DAC donors, European Union institutions (current US$)"
## [677] "Net bilateral aid flows from DAC donors, Finland (current US$)"
## [678] "Net bilateral aid flows from DAC donors, France (current US$)"
## [679] "Net bilateral aid flows from DAC donors, Germany (current US$)"
## [680] "Net bilateral aid flows from DAC donors, Greece (current US$)"
## [681] "Net bilateral aid flows from DAC donors, Hungary (current US$)"
## [682] "Net bilateral aid flows from DAC donors, Iceland (current US$)"
## [683] "Net bilateral aid flows from DAC donors, Ireland (current US$)"
## [684] "Net bilateral aid flows from DAC donors, Italy (current US$)"
## [685] "Net bilateral aid flows from DAC donors, Japan (current US$)"
## [686] "Net bilateral aid flows from DAC donors, Korea, Rep. (current US$)"
## [687] "Net bilateral aid flows from DAC donors, Luxembourg (current US$)"
## [688] "Net bilateral aid flows from DAC donors, Netherlands (current US$)"
## [689] "Net bilateral aid flows from DAC donors, New Zealand (current US$)"
## [690] "Net bilateral aid flows from DAC donors, Norway (current US$)"
## [691] "Net bilateral aid flows from DAC donors, Poland (current US$)"
## [692] "Net bilateral aid flows from DAC donors, Portugal (current US$)"
## [693] "Net bilateral aid flows from DAC donors, Slovak Republic (current US$)"
## [694] "Net bilateral aid flows from DAC donors, Slovenia (current US$)"
## [695] "Net bilateral aid flows from DAC donors, Spain (current US$)"
## [696] "Net bilateral aid flows from DAC donors, Sweden (current US$)"
## [697] "Net bilateral aid flows from DAC donors, Switzerland (current US$)"
## [698] "Net bilateral aid flows from DAC donors, Total (current US$)"
## [699] "Net bilateral aid flows from DAC donors, United Kingdom (current US$)"
## [700] "Net bilateral aid flows from DAC donors, United States (current US$)"
## [701] "Net capital account (BoP, current US$)"
## [702] "Net domestic credit (current LCU)"
## [703] "Net errors and omissions (BoP, current US$)"
## [704] "Net financial account (BoP, current US$)"
## [705] "Net financial flows, bilateral (NFL, current US$)"
## [706] "Net financial flows, IBRD (NFL, current US$)"
## [707] "Net financial flows, IDA (NFL, current US$)"
## [708] "Net financial flows, IMF concessional (NFL, current US$)"
## [709] "Net financial flows, IMF nonconcessional (NFL, current US$)"
## [710] "Net financial flows, multilateral (NFL, current US$)"
## [711] "Net financial flows, others (NFL, current US$)"
## [712] "Net financial flows, RDB concessional (NFL, current US$)"
## [713] "Net financial flows, RDB nonconcessional (NFL, current US$)"
## [714] "Net flows on external debt, private nonguaranteed (PNG) (NFL, current US$)"
## [715] "Net foreign assets (current LCU)"
## [716] "Net incurrence of liabilities, total (% of GDP)"
## [717] "Net incurrence of liabilities, total (current LCU)"
## [718] "Net intake rate in grade 1 (% of official school-age population)"
## [719] "Net intake rate in grade 1, female (% of official school-age population)"
## [720] "Net intake rate in grade 1, male (% of official school-age population)"
## [721] "Net investment in nonfinancial assets (% of GDP)"
## [722] "Net investment in nonfinancial assets (current LCU)"
## [723] "Net lending (+) / net borrowing (-) (% of GDP)"
## [724] "Net lending (+) / net borrowing (-) (current LCU)"
## [725] "Net migration"
## [726] "Net ODA received (% of central government expense)"
## [727] "Net ODA received (% of GNI)"
## [728] "Net ODA received (% of gross capital formation)"
## [729] "Net ODA received (% of imports of goods, services and primary income)"
## [730] "Net ODA received per capita (current US$)"
## [731] "Net official development assistance and official aid received (constant 2015 US$)"
## [732] "Net official development assistance and official aid received (current US$)"
## [733] "Net official development assistance received (constant 2015 US$)"
## [734] "Net official development assistance received (current US$)"
## [735] "Net official flows from UN agencies, FAO (current US$)"
## [736] "Net official flows from UN agencies, IAEA (current US$)"
## [737] "Net official flows from UN agencies, IFAD (current US$)"
## [738] "Net official flows from UN agencies, ILO (current US$)"
## [739] "Net official flows from UN agencies, UNDP (current US$)"
## [740] "Net official flows from UN agencies, UNFPA (current US$)"
## [741] "Net official flows from UN agencies, UNHCR (current US$)"
## [742] "Net official flows from UN agencies, UNICEF (current US$)"
## [743] "Net official flows from UN agencies, UNTA (current US$)"
## [744] "Net official flows from UN agencies, WFP (current US$)"
## [745] "Net official flows from UN agencies, WHO (current US$)"
## [746] "Net primary income (BoP, current US$)"
## [747] "Net primary income (Net income from abroad) (current LCU)"
## [748] "Net primary income (Net income from abroad) (current US$)"
## [749] "Net secondary income (BoP, current US$)"
## [750] "Net secondary income (Net current transfers from abroad) (current LCU)"
## [751] "Net secondary income (Net current transfers from abroad) (current US$)"
## [752] "Net trade in goods (BoP, current US$)"
## [753] "Net trade in goods and services (BoP, current US$)"
## [754] "New business density (new registrations per 1,000 people ages 15-64)"
## [755] "New businesses registered (number)"
## [756] "Newborns protected against tetanus (%)"
## [757] "Nitrous oxide emissions (% change from 1990)"
## [758] "Nitrous oxide emissions (thousand metric tons of CO2 equivalent)"
## [759] "Nitrous oxide emissions in energy sector (% of total)"
## [760] "Nitrous oxide emissions in energy sector (thousand metric tons of CO2 equivalent)"
## [761] "Number of deaths ages 5-14 years"
## [762] "Number of infant deaths"
## [763] "Number of maternal deaths"
## [764] "Number of neonatal deaths"
## [765] "Number of under-five deaths"
## [766] "Nurses and midwives (per 1,000 people)"
## [767] "Official exchange rate (LCU per US$, period average)"
## [768] "Oil rents (% of GDP)"
## [769] "Ores and metals exports (% of merchandise exports)"
## [770] "Ores and metals imports (% of merchandise imports)"
## [771] "Other expense (% of expense)"
## [772] "Other expense (current LCU)"
## [773] "Other greenhouse gas emissions (% change from 1990)"
## [774] "Other greenhouse gas emissions, HFC, PFC and SF6 (thousand metric tons of CO2 equivalent)"
## [775] "Other taxes (% of revenue)"
## [776] "Other taxes (current LCU)"
## [777] "Other taxes payable by businesses (% of commercial profits)"
## [778] "Out-of-pocket expenditure (% of current health expenditure)"
## [779] "Out-of-pocket expenditure per capita (current US$)"
## [780] "Out-of-pocket expenditure per capita, PPP (current international $)"
## [781] "Over-age students, primary (% of enrollment)"
## [782] "Over-age students, primary, female (% of female enrollment)"
## [783] "Over-age students, primary, male (% of male enrollment)"
## [784] "Part time employment, female (% of total female employment)"
## [785] "Part time employment, male (% of total male employment)"
## [786] "Part time employment, total (% of total employment)"
## [787] "People practicing open defecation (% of population)"
## [788] "People practicing open defecation, rural (% of rural population)"
## [789] "People practicing open defecation, urban (% of urban population)"
## [790] "People using at least basic drinking water services (% of population)"
## [791] "People using at least basic drinking water services, rural (% of rural population)"
## [792] "People using at least basic drinking water services, urban (% of urban population)"
## [793] "People using at least basic sanitation services (% of population)"
## [794] "People using at least basic sanitation services, rural (% of rural population)"
## [795] "People using at least basic sanitation services, urban (% of urban population)"
## [796] "People with basic handwashing facilities including soap and water (% of population)"
## [797] "People with basic handwashing facilities including soap and water, rural (% of rural population)"
## [798] "People with basic handwashing facilities including soap and water, urban (% of urban population)"
## [799] "Periodicity and timeliness assessment of statistical capacity (scale 0 - 100)"
## [800] "Permanent cropland (% of land area)"
## [801] "Persistence to grade 5, female (% of cohort)"
## [802] "Persistence to grade 5, male (% of cohort)"
## [803] "Persistence to grade 5, total (% of cohort)"
## [804] "Persistence to last grade of primary, female (% of cohort)"
## [805] "Persistence to last grade of primary, male (% of cohort)"
## [806] "Persistence to last grade of primary, total (% of cohort)"
## [807] "Personal remittances, paid (current US$)"
## [808] "Personal remittances, received (% of GDP)"
## [809] "Personal remittances, received (current US$)"
## [810] "Personal transfers, receipts (BoP, current US$)"
## [811] "Physicians (per 1,000 people)"
## [812] "Plant species (higher), threatened"
## [813] "PM2.5 air pollution, mean annual exposure (micrograms per cubic meter)"
## [814] "PM2.5 air pollution, population exposed to levels exceeding WHO guideline value (% of total)"
## [815] "PM2.5 pollution, population exposed to levels exceeding WHO Interim Target-1 value (% of total)"
## [816] "PM2.5 pollution, population exposed to levels exceeding WHO Interim Target-2 value (% of total)"
## [817] "PM2.5 pollution, population exposed to levels exceeding WHO Interim Target-3 value (% of total)"
## [818] "PNG, bonds (NFL, current US$)"
## [819] "PNG, commercial banks and other creditors (NFL, current US$)"
## [820] "Population ages 0-14 (% of total population)"
## [821] "Population ages 0-14, female"
## [822] "Population ages 0-14, female (% of female population)"
## [823] "Population ages 0-14, male"
## [824] "Population ages 0-14, male (% of male population)"
## [825] "Population ages 0-14, total"
## [826] "Population ages 00-04, female (% of female population)"
## [827] "Population ages 00-04, male (% of male population)"
## [828] "Population ages 05-09, female (% of female population)"
## [829] "Population ages 05-09, male (% of male population)"
## [830] "Population ages 10-14, female (% of female population)"
## [831] "Population ages 10-14, male (% of male population)"
## [832] "Population ages 15-19, female (% of female population)"
## [833] "Population ages 15-19, male (% of male population)"
## [834] "Population ages 15-64 (% of total population)"
## [835] "Population ages 15-64, female"
## [836] "Population ages 15-64, female (% of female population)"
## [837] "Population ages 15-64, male"
## [838] "Population ages 15-64, male (% of male population)"
## [839] "Population ages 15-64, total"
## [840] "Population ages 20-24, female (% of female population)"
## [841] "Population ages 20-24, male (% of male population)"
## [842] "Population ages 25-29, female (% of female population)"
## [843] "Population ages 25-29, male (% of male population)"
## [844] "Population ages 30-34, female (% of female population)"
## [845] "Population ages 30-34, male (% of male population)"
## [846] "Population ages 35-39, female (% of female population)"
## [847] "Population ages 35-39, male (% of male population)"
## [848] "Population ages 40-44, female (% of female population)"
## [849] "Population ages 40-44, male (% of male population)"
## [850] "Population ages 45-49, female (% of female population)"
## [851] "Population ages 45-49, male (% of male population)"
## [852] "Population ages 50-54, female (% of female population)"
## [853] "Population ages 50-54, male (% of male population)"
## [854] "Population ages 55-59, female (% of female population)"
## [855] "Population ages 55-59, male (% of male population)"
## [856] "Population ages 60-64, female (% of female population)"
## [857] "Population ages 60-64, male (% of male population)"
## [858] "Population ages 65 and above (% of total population)"
## [859] "Population ages 65 and above, female"
## [860] "Population ages 65 and above, female (% of female population)"
## [861] "Population ages 65 and above, male"
## [862] "Population ages 65 and above, male (% of male population)"
## [863] "Population ages 65 and above, total"
## [864] "Population ages 65-69, female (% of female population)"
## [865] "Population ages 65-69, male (% of male population)"
## [866] "Population ages 70-74, female (% of female population)"
## [867] "Population ages 70-74, male (% of male population)"
## [868] "Population ages 75-79, female (% of female population)"
## [869] "Population ages 75-79, male (% of male population)"
## [870] "Population ages 80 and above, female (% of female population)"
## [871] "Population ages 80 and above, male (% of male population)"
## [872] "Population density (people per sq. km of land area)"
## [873] "Population growth (annual %)"
## [874] "Population in largest city"
## [875] "Population in the largest city (% of urban population)"
## [876] "Population in urban agglomerations of more than 1 million"
## [877] "Population in urban agglomerations of more than 1 million (% of total population)"
## [878] "Population living in slums (% of urban population)"
## [879] "Population, female"
## [880] "Population, female (% of total population)"
## [881] "Population, male"
## [882] "Population, male (% of total population)"
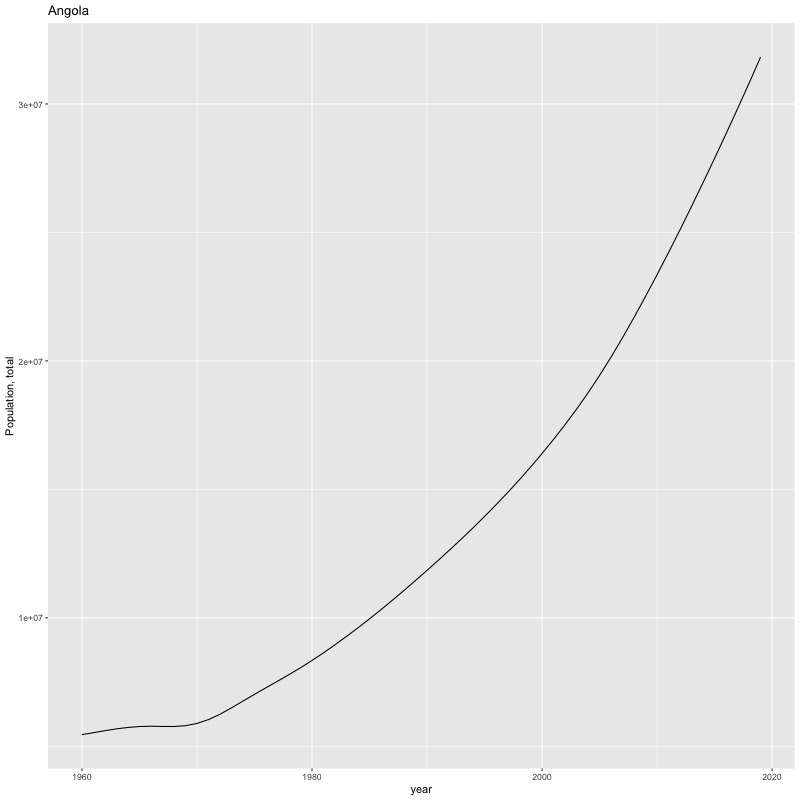
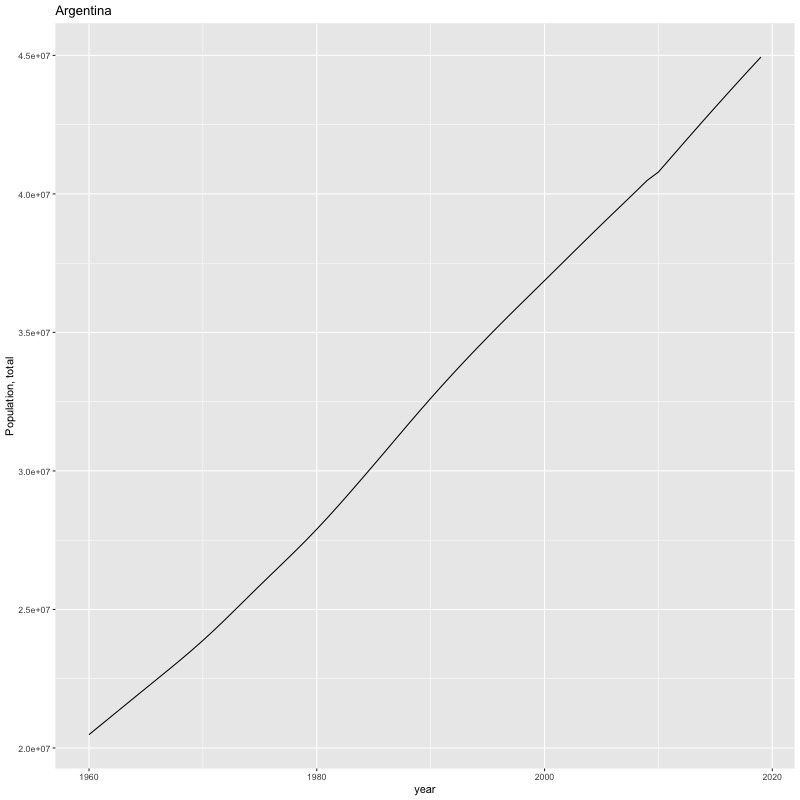
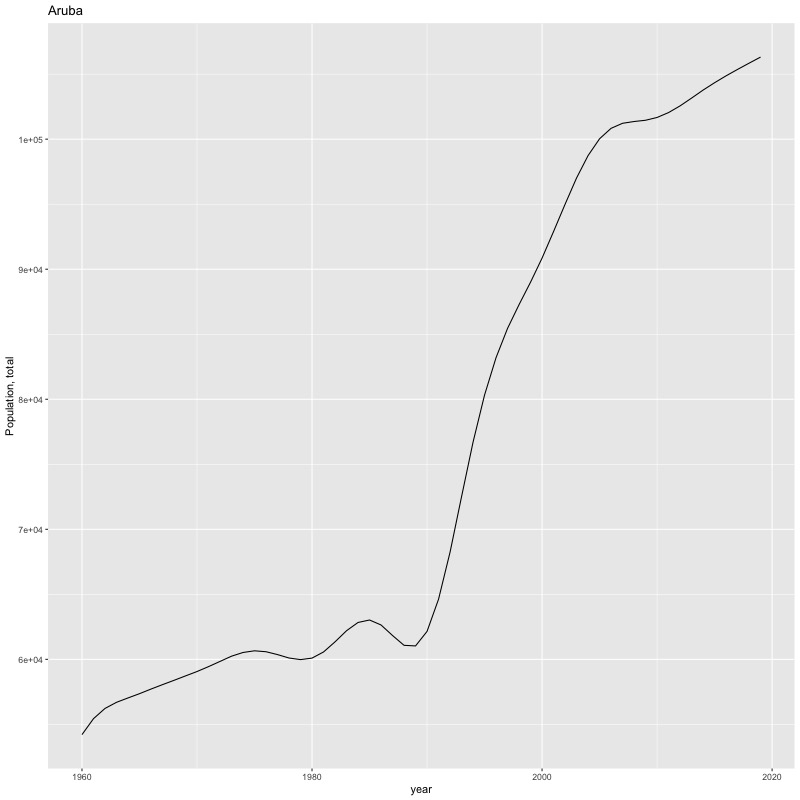
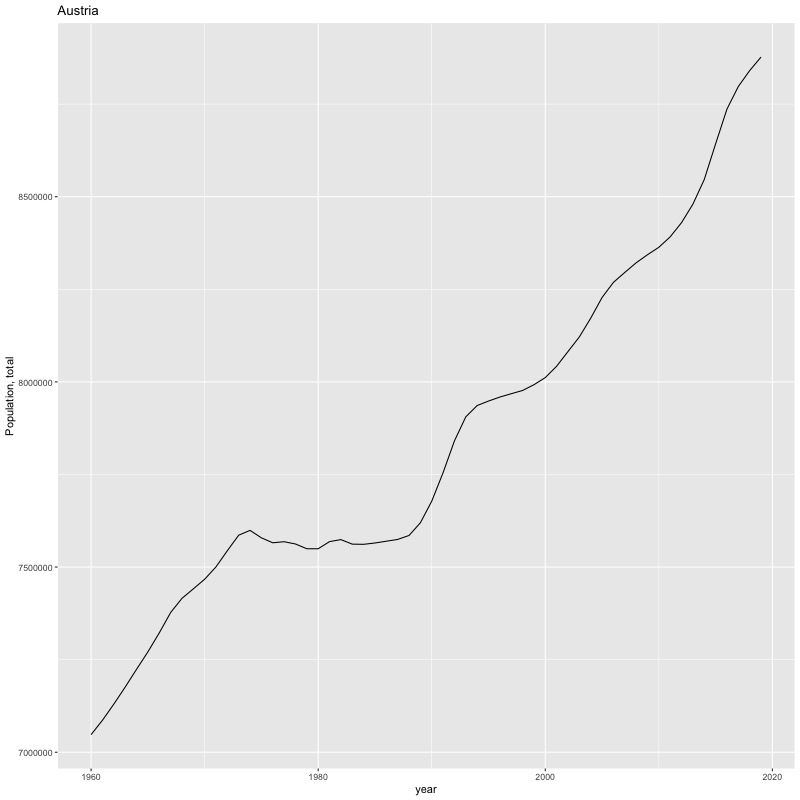
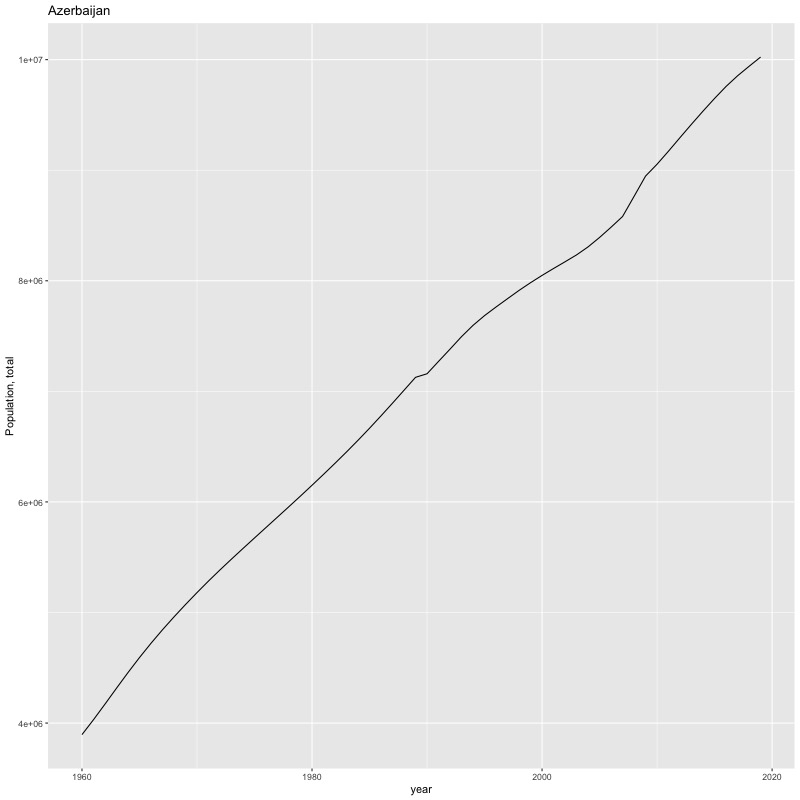
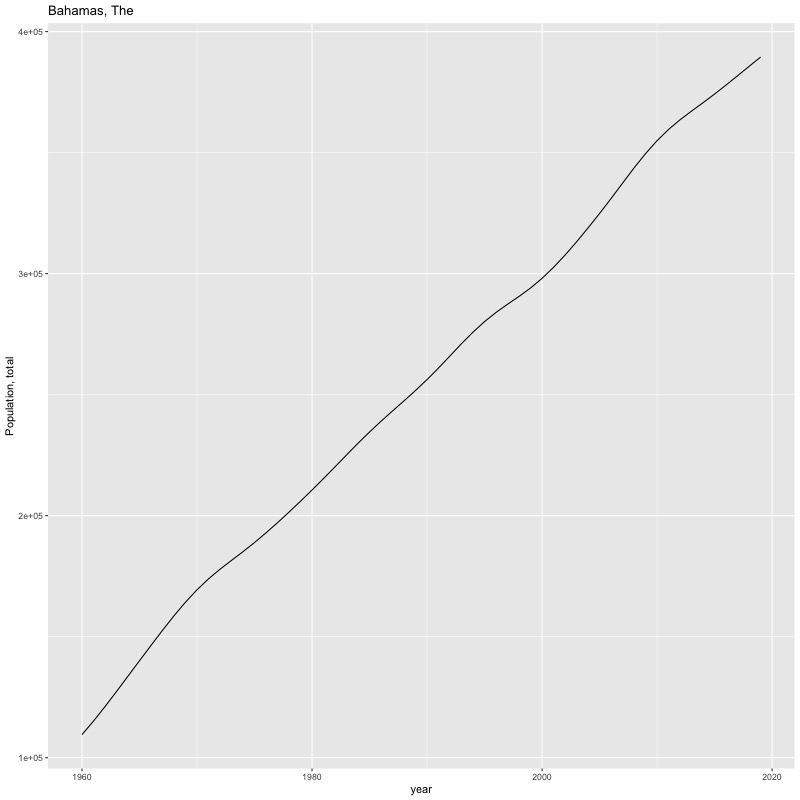
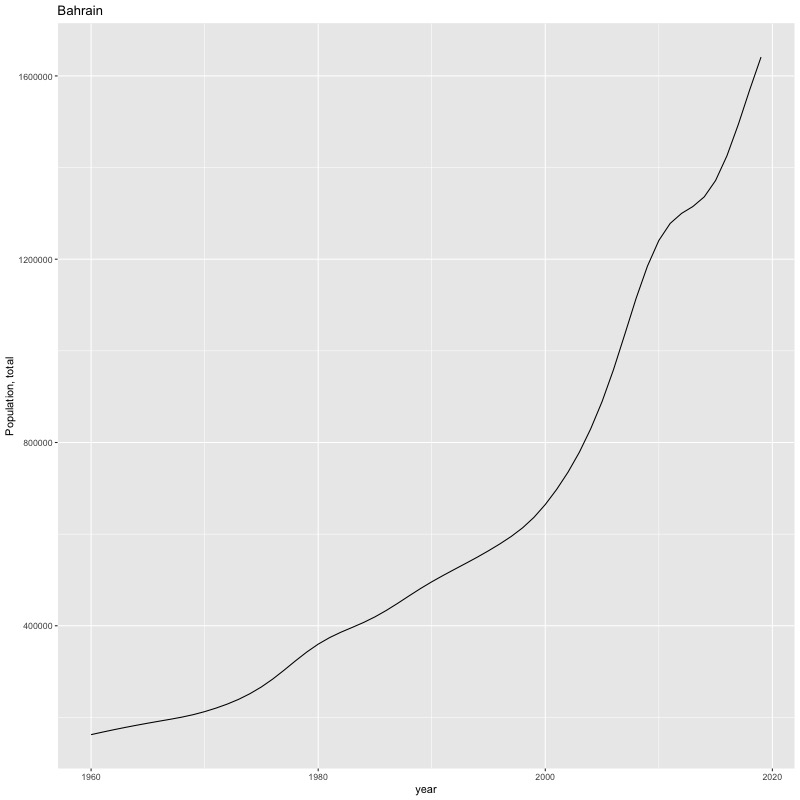
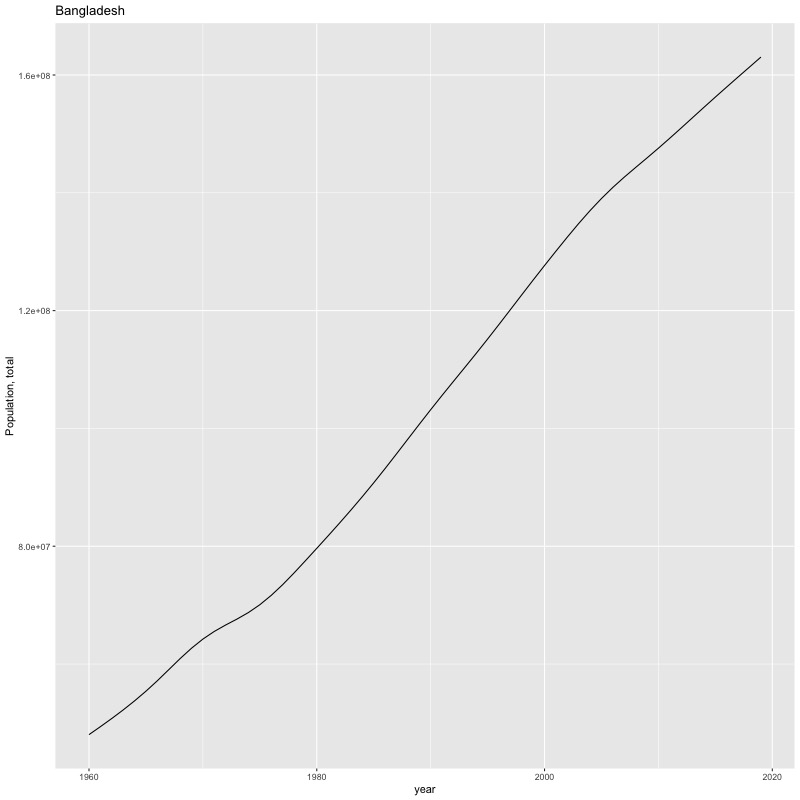
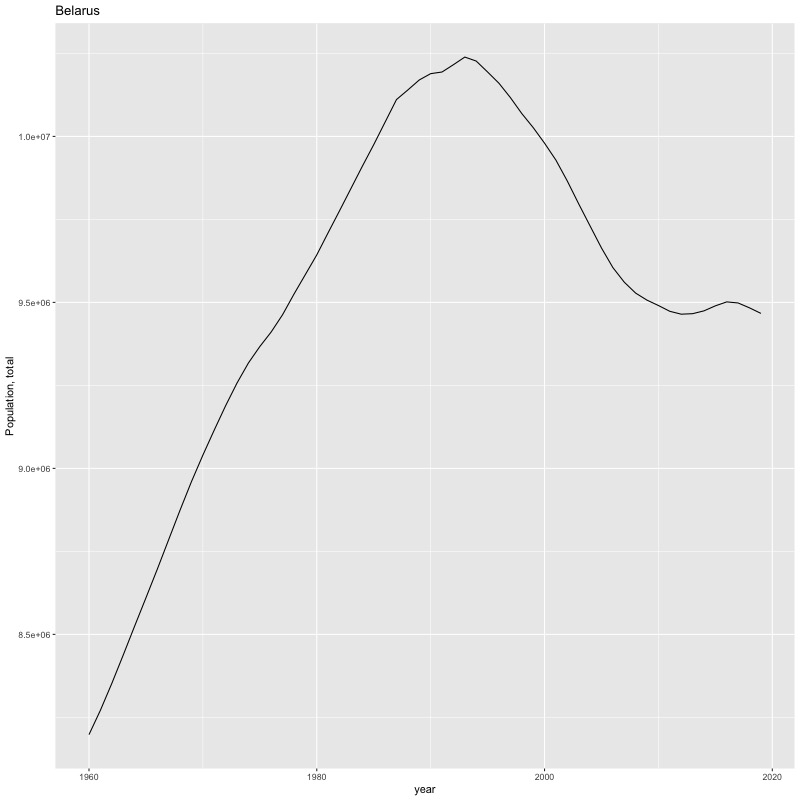
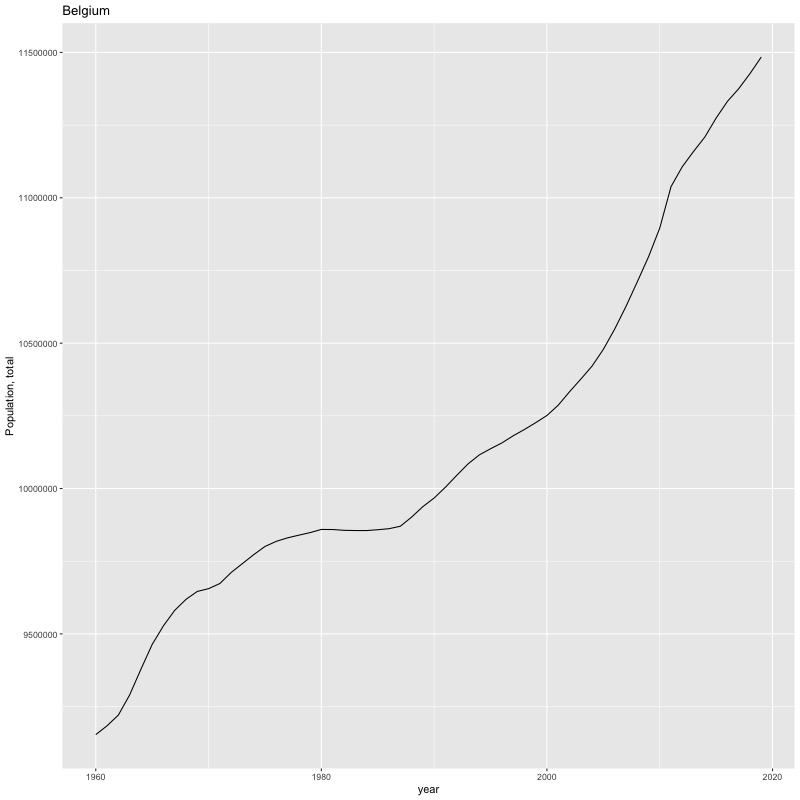
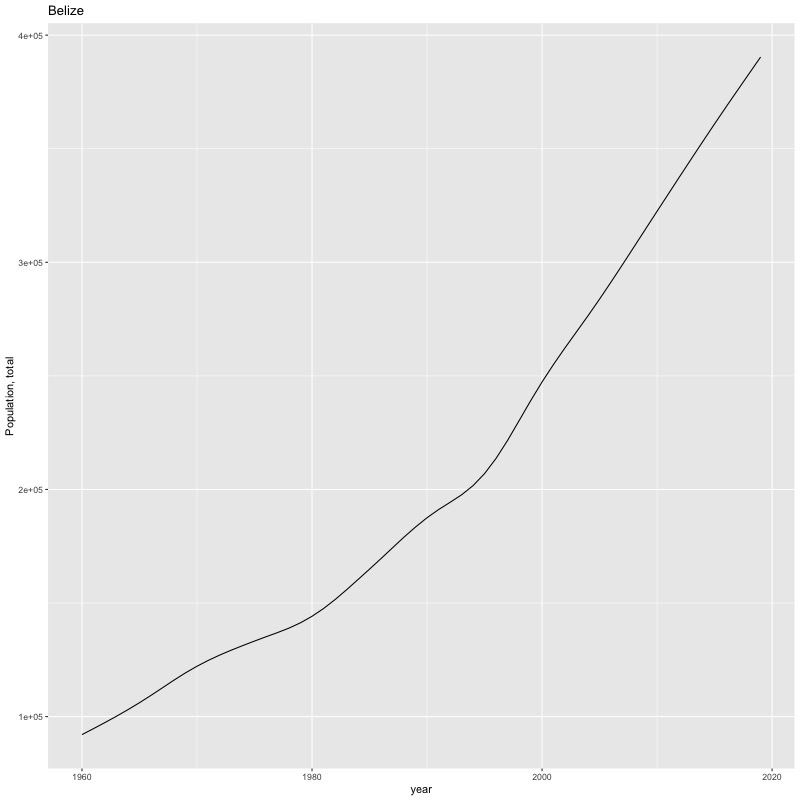
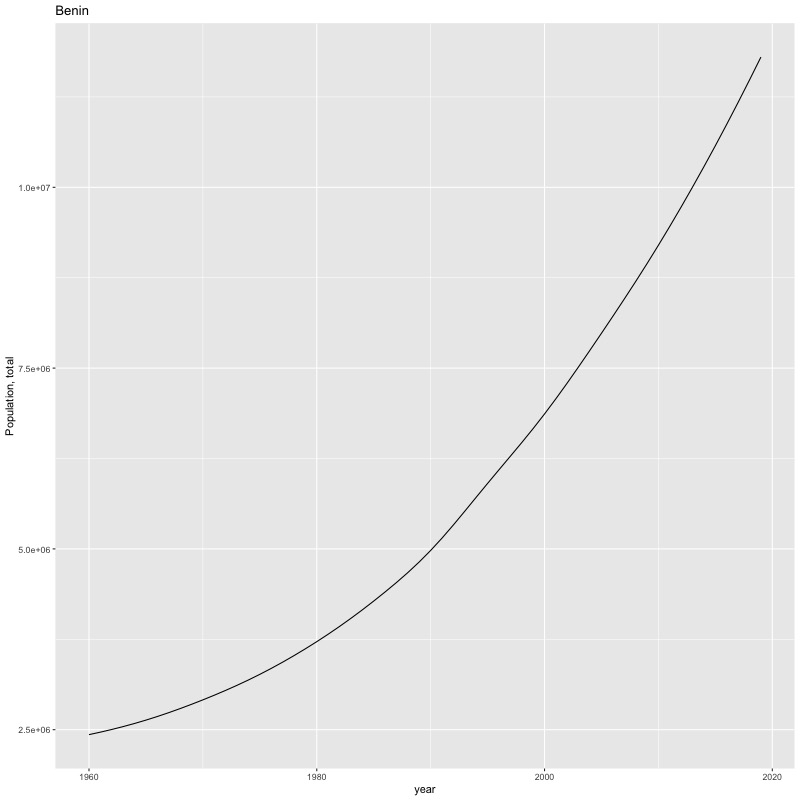
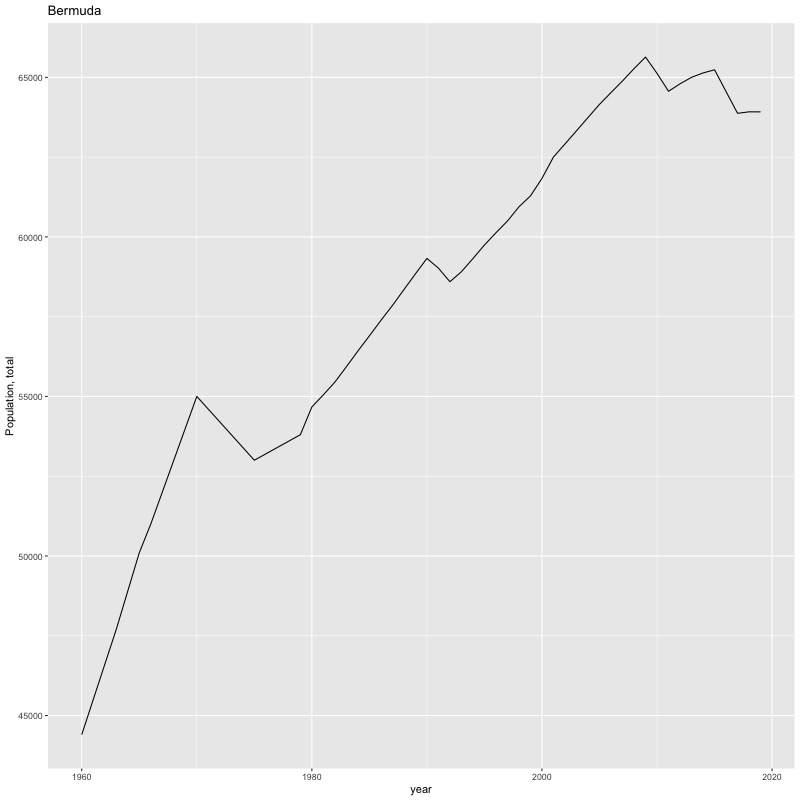
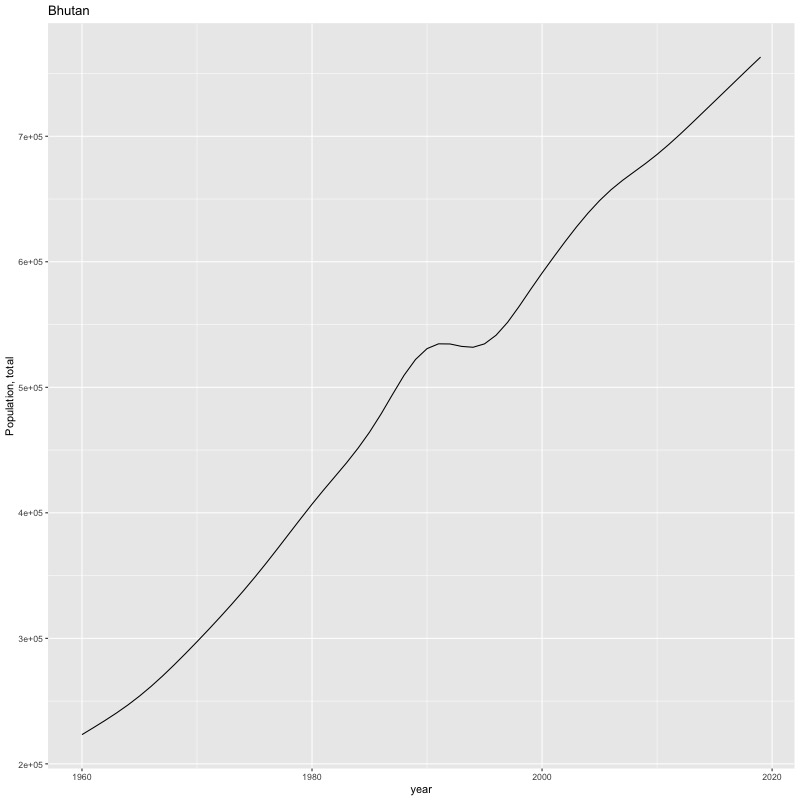
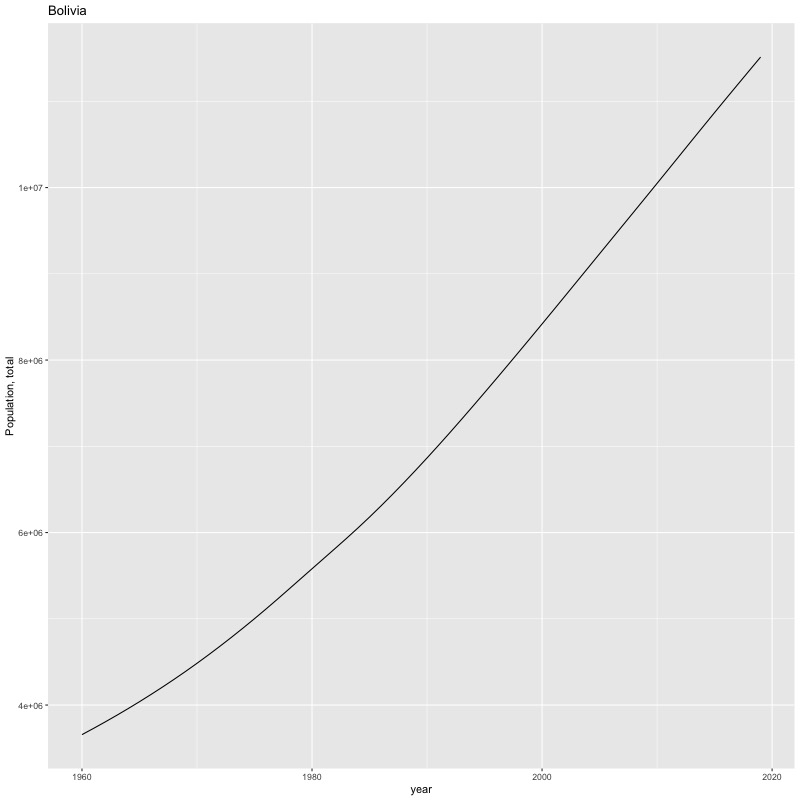
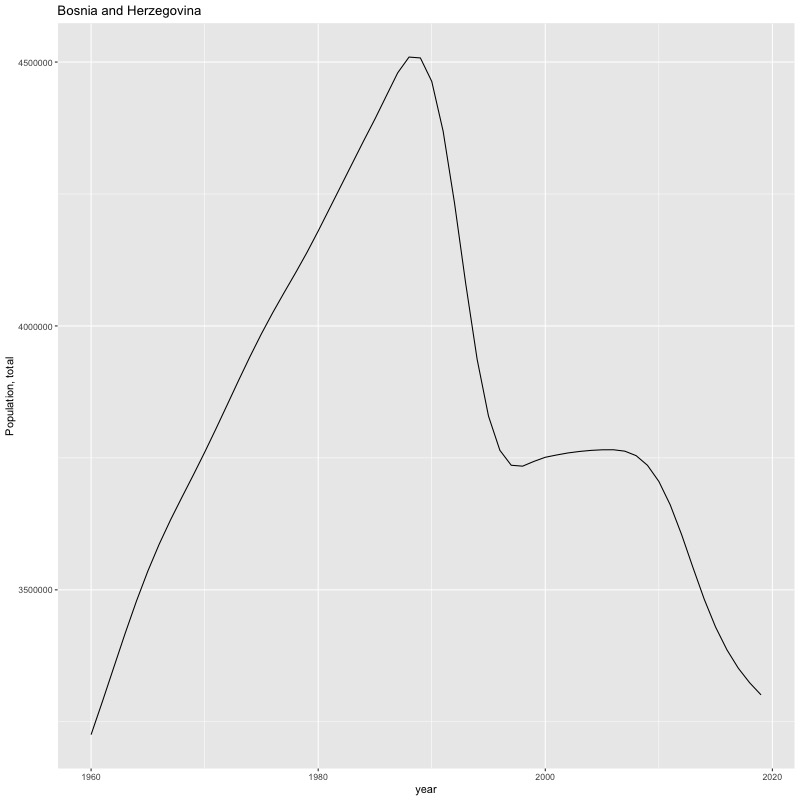
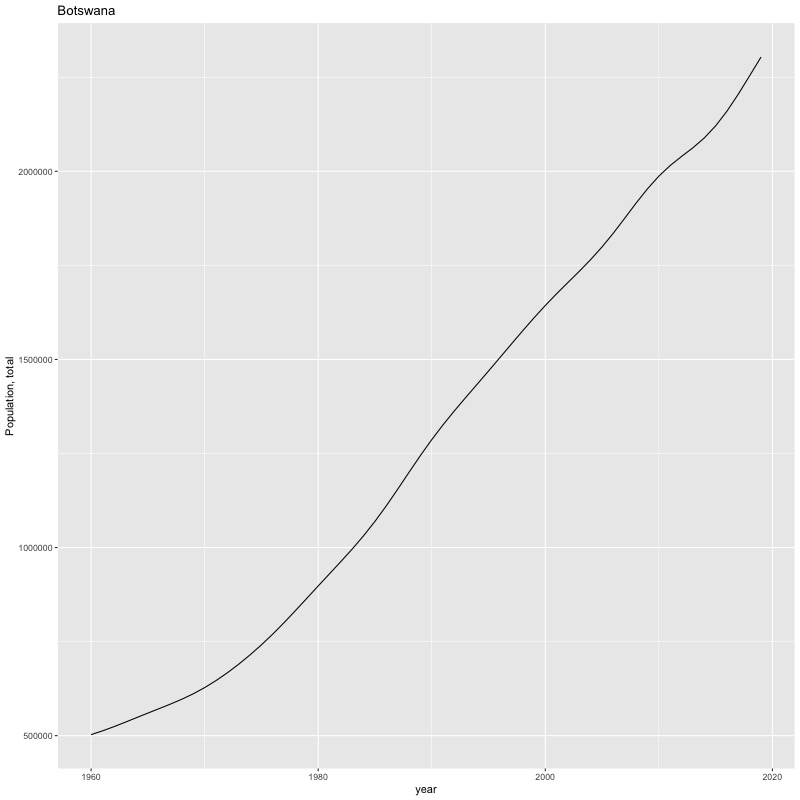
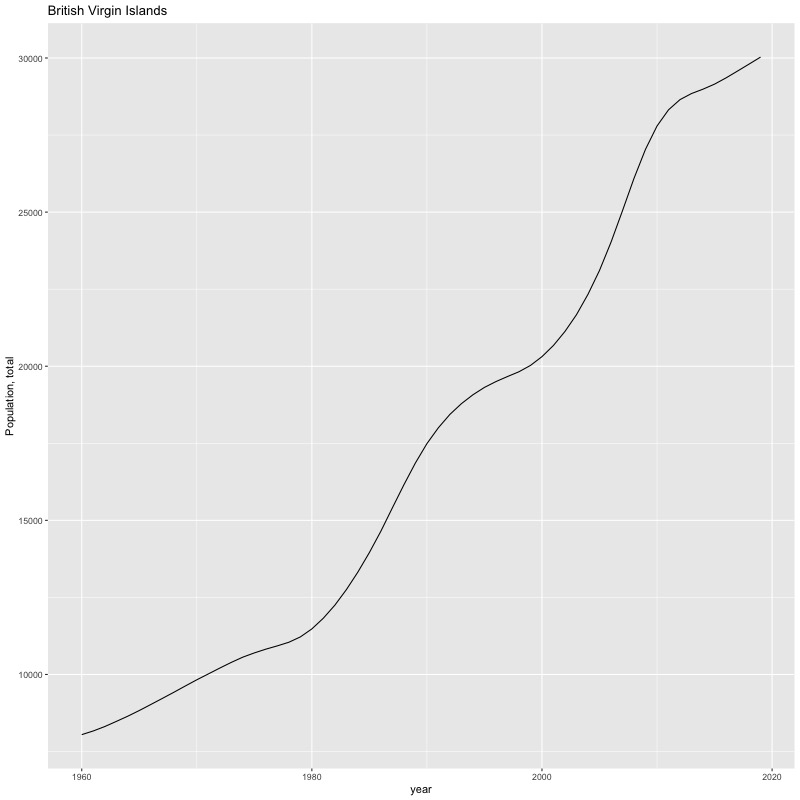
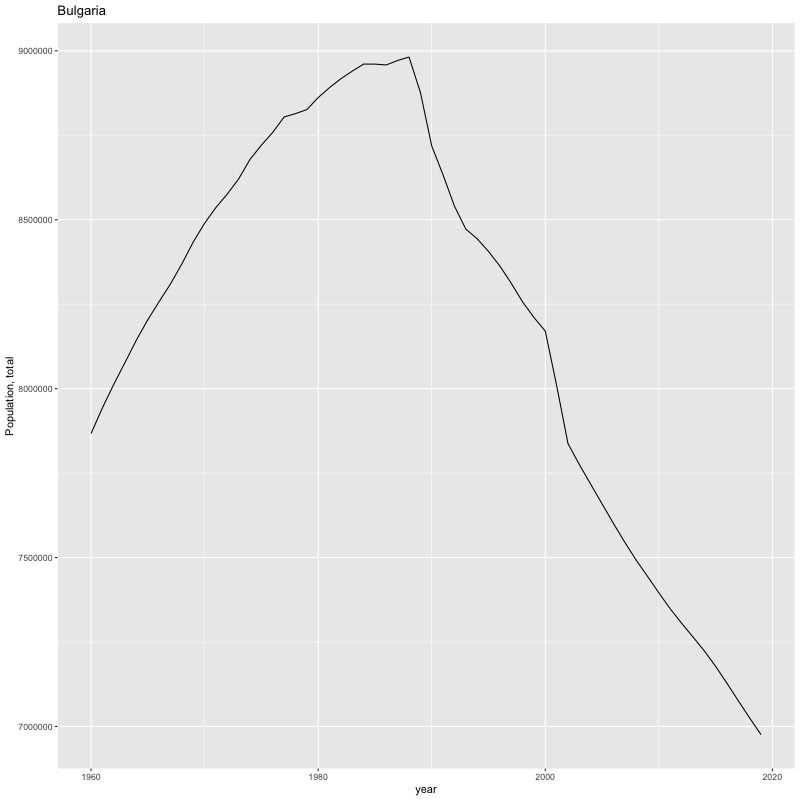
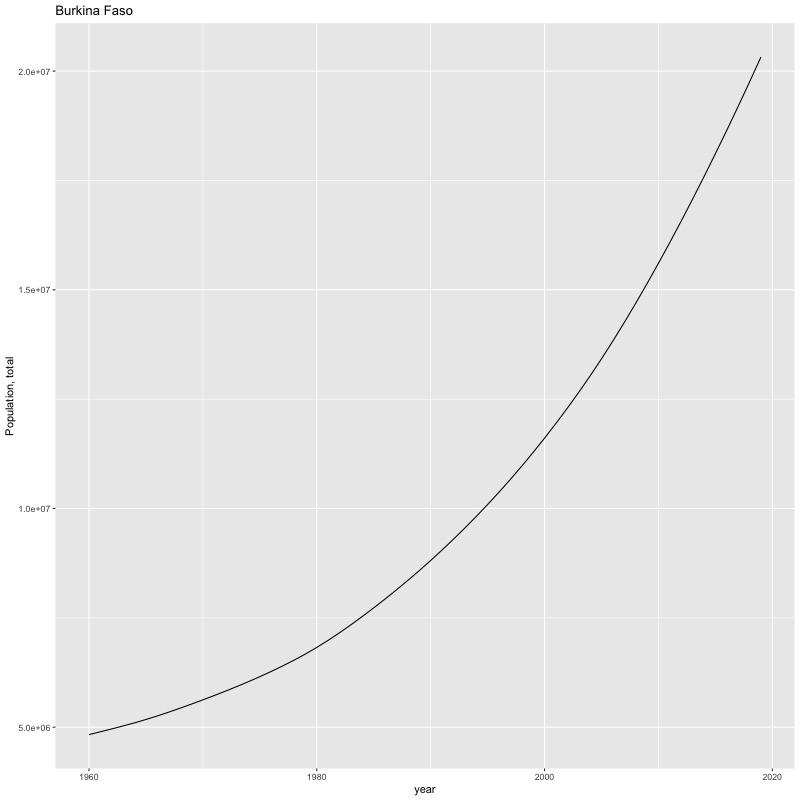
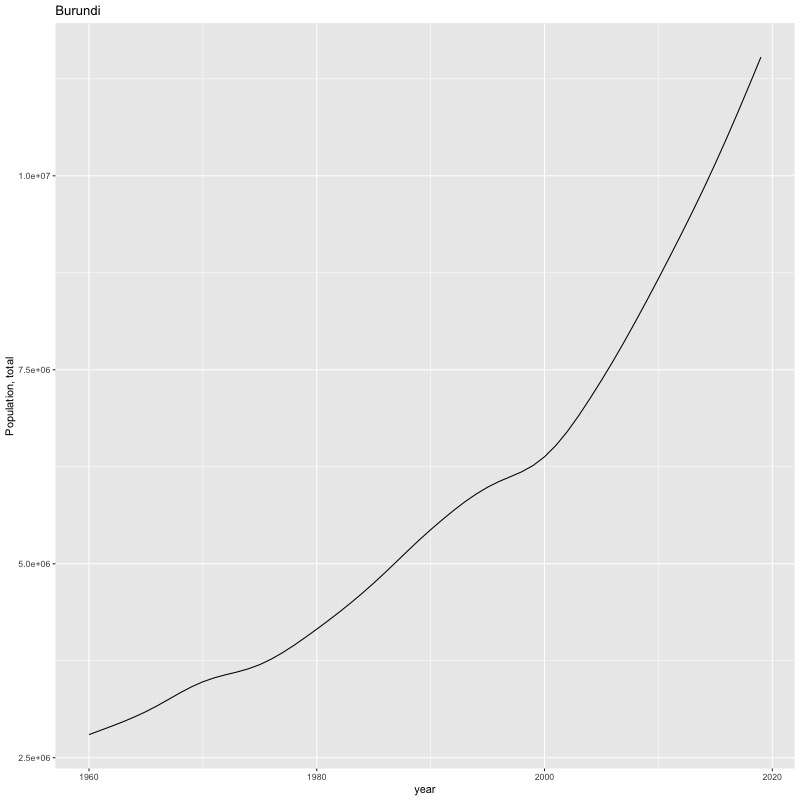
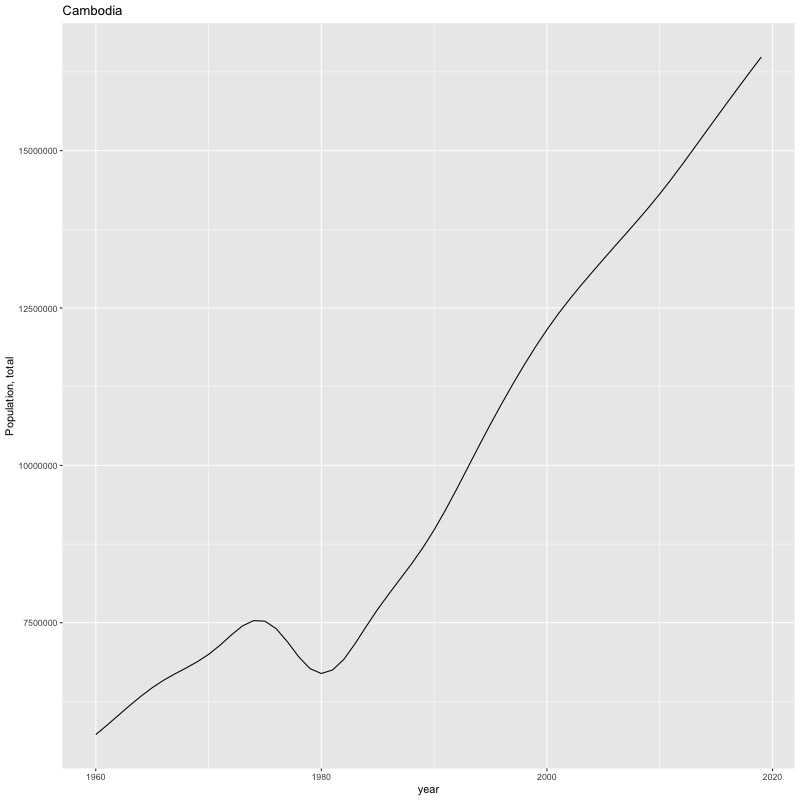
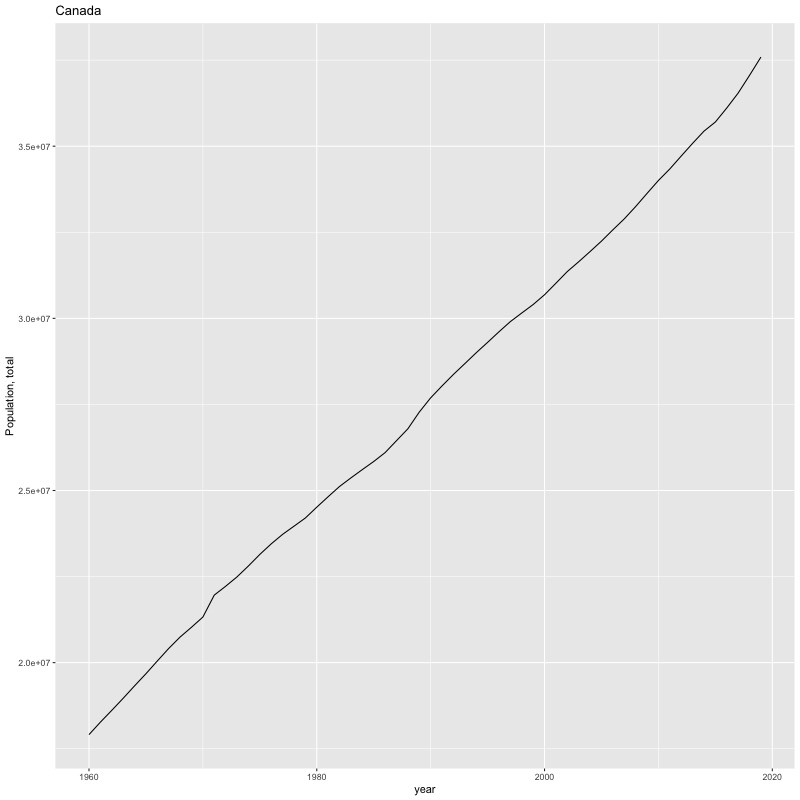
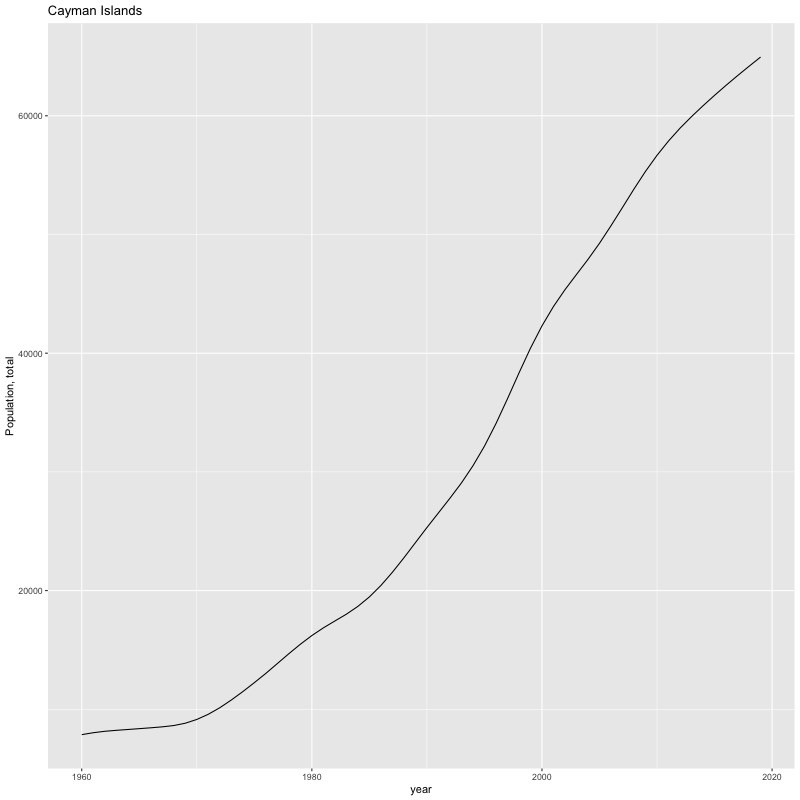
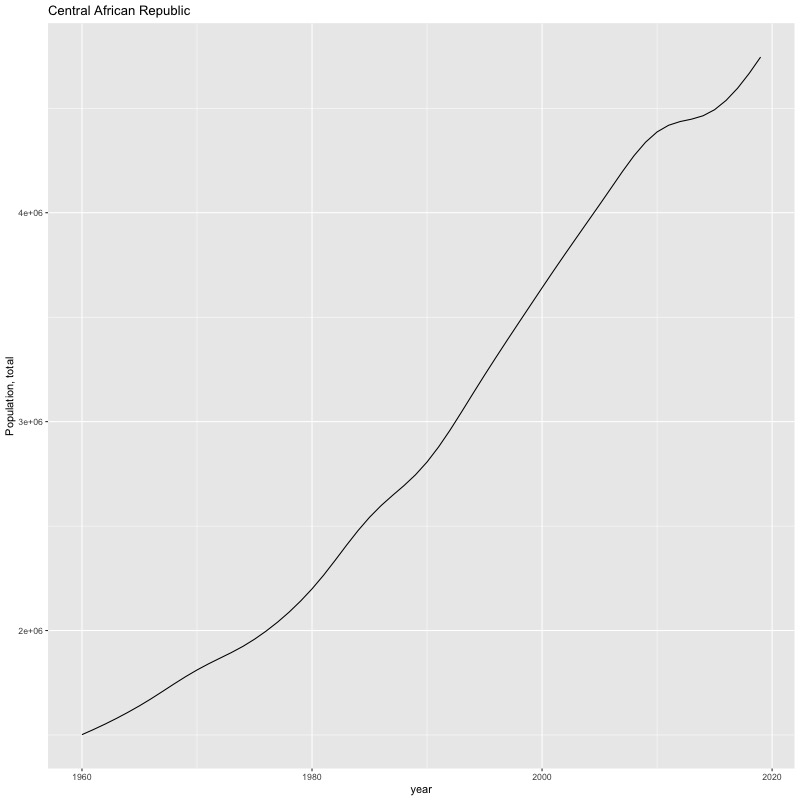
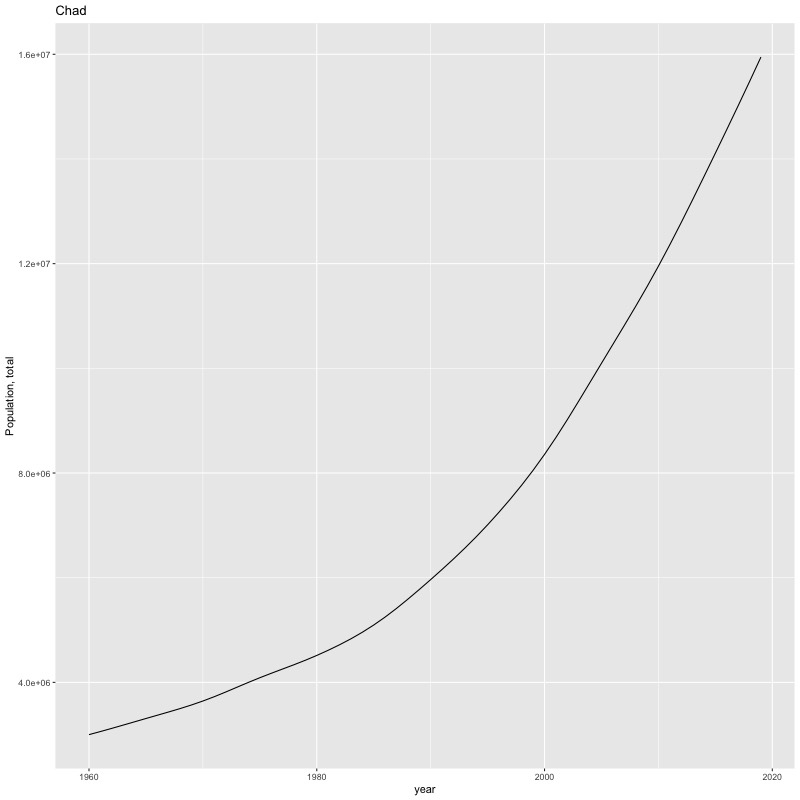
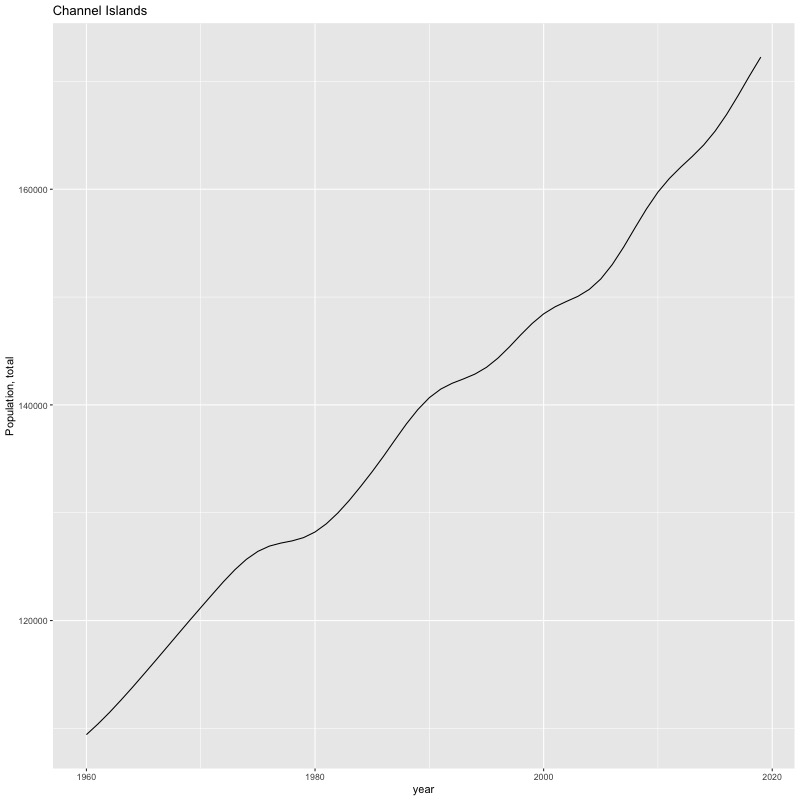
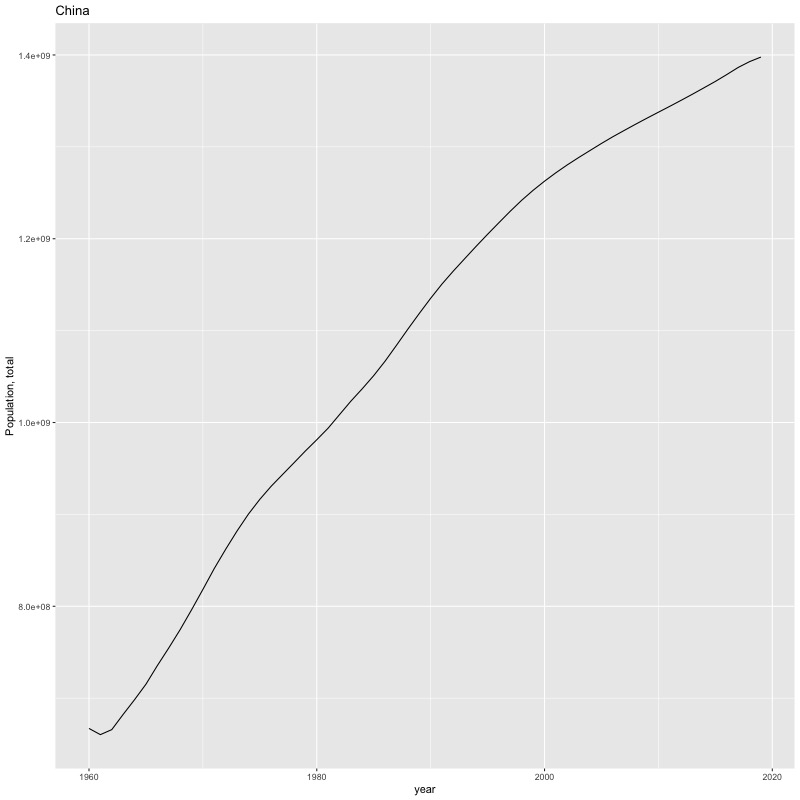
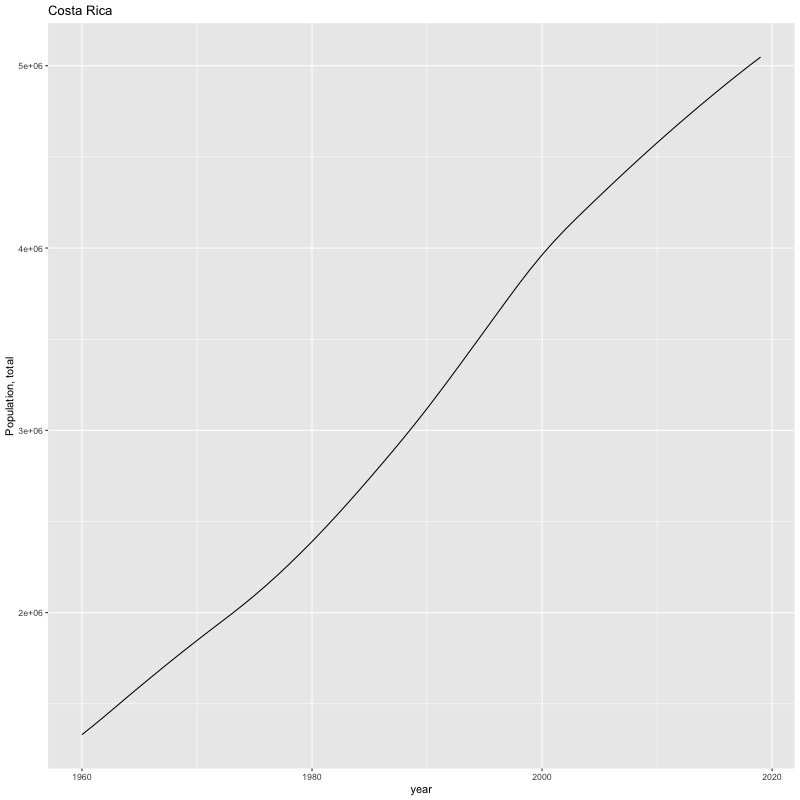
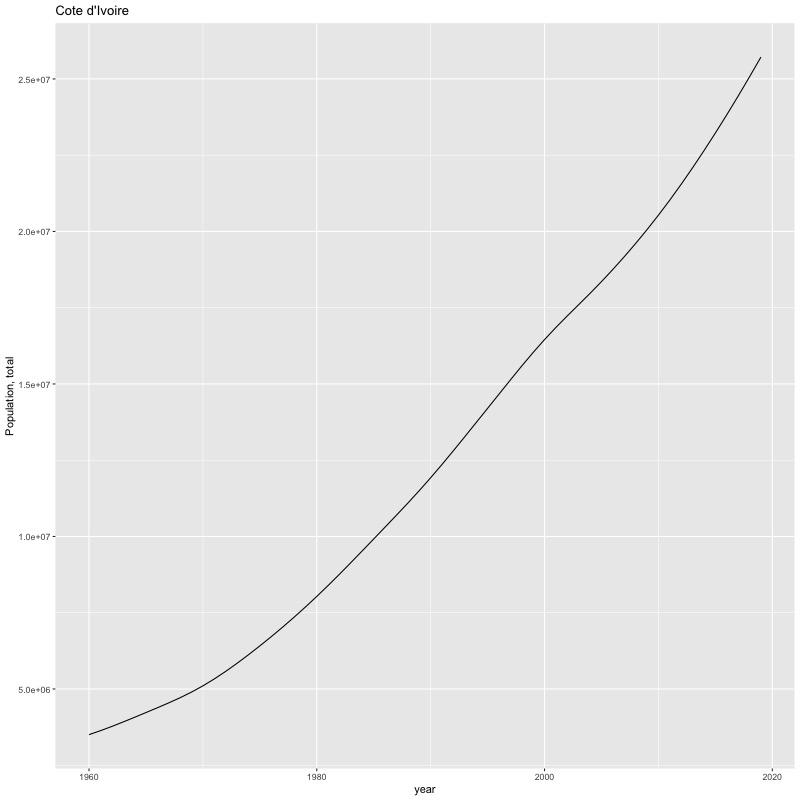
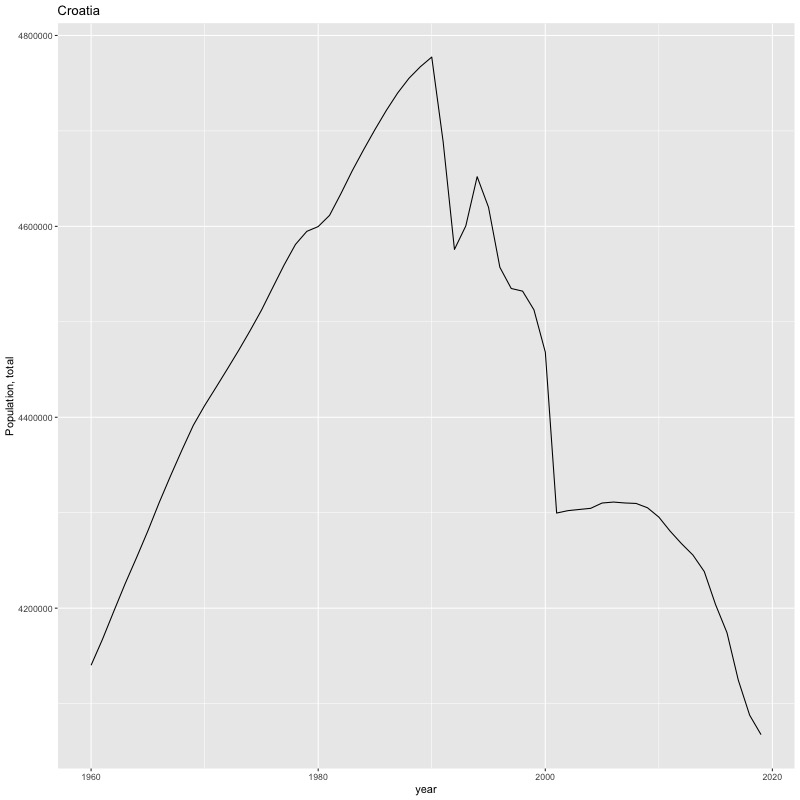
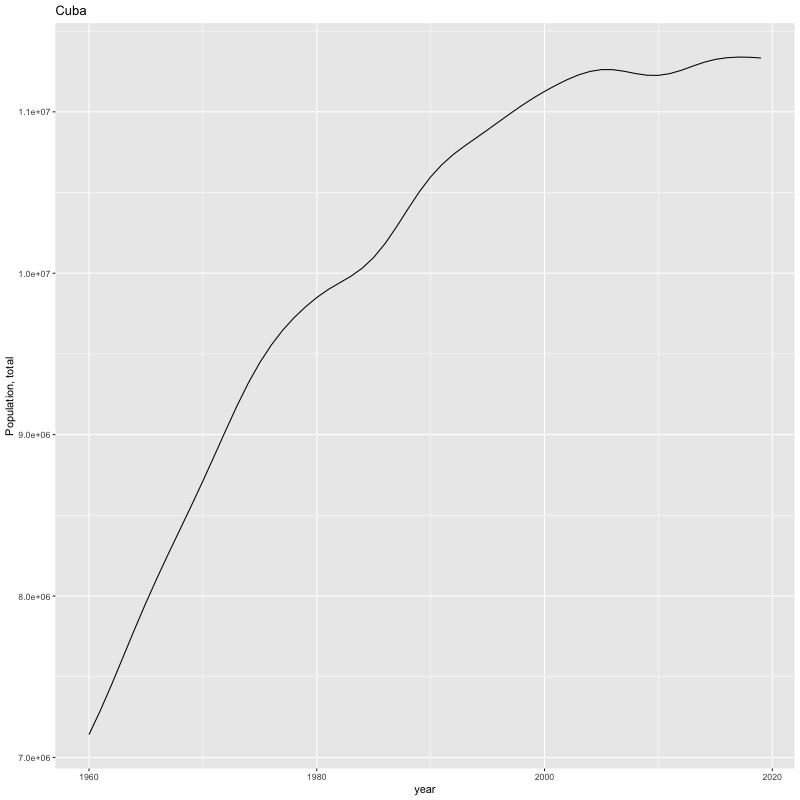
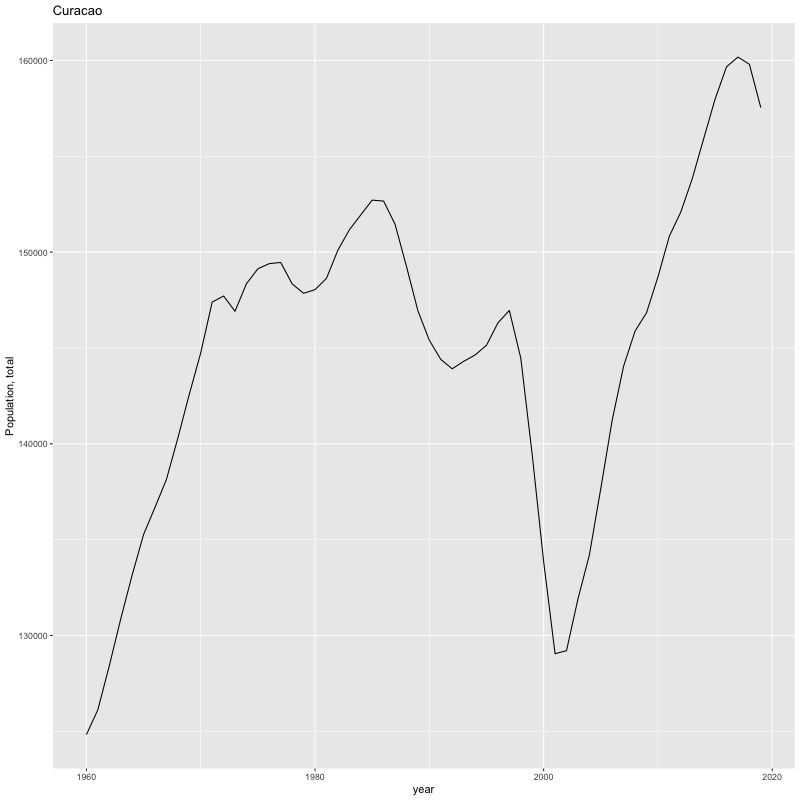
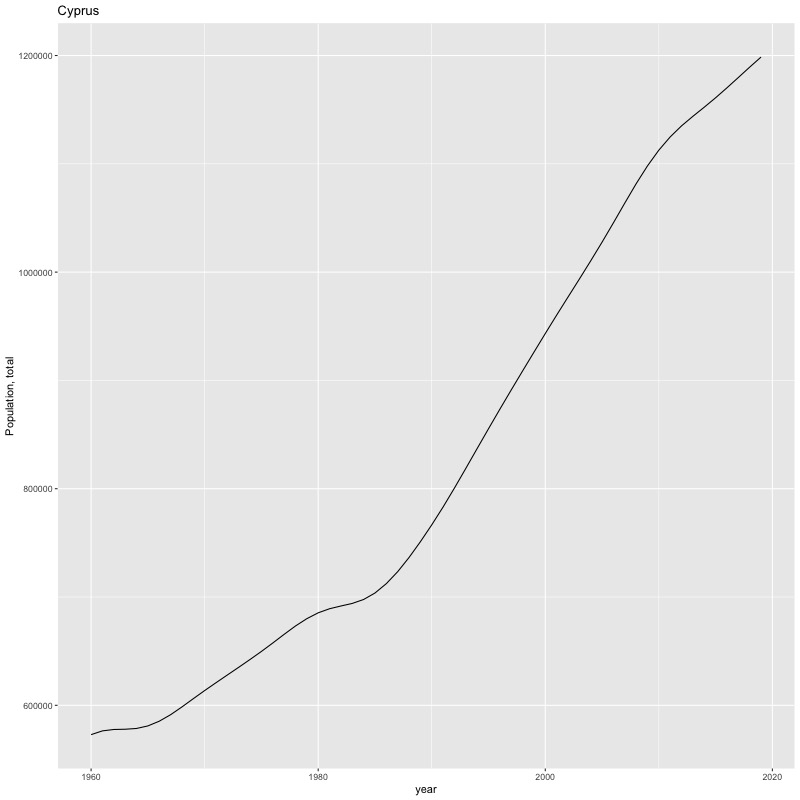
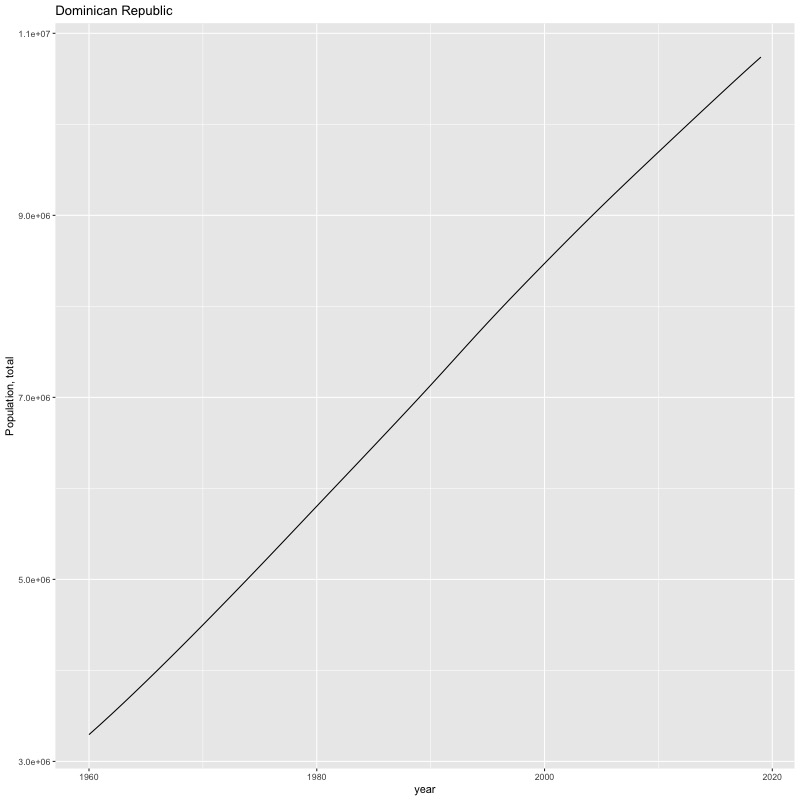
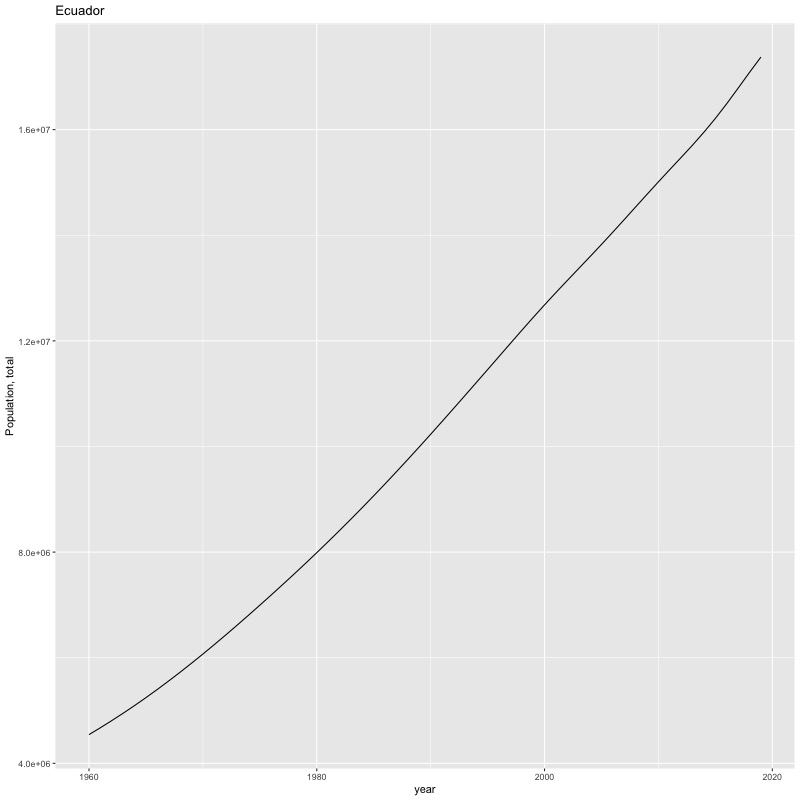
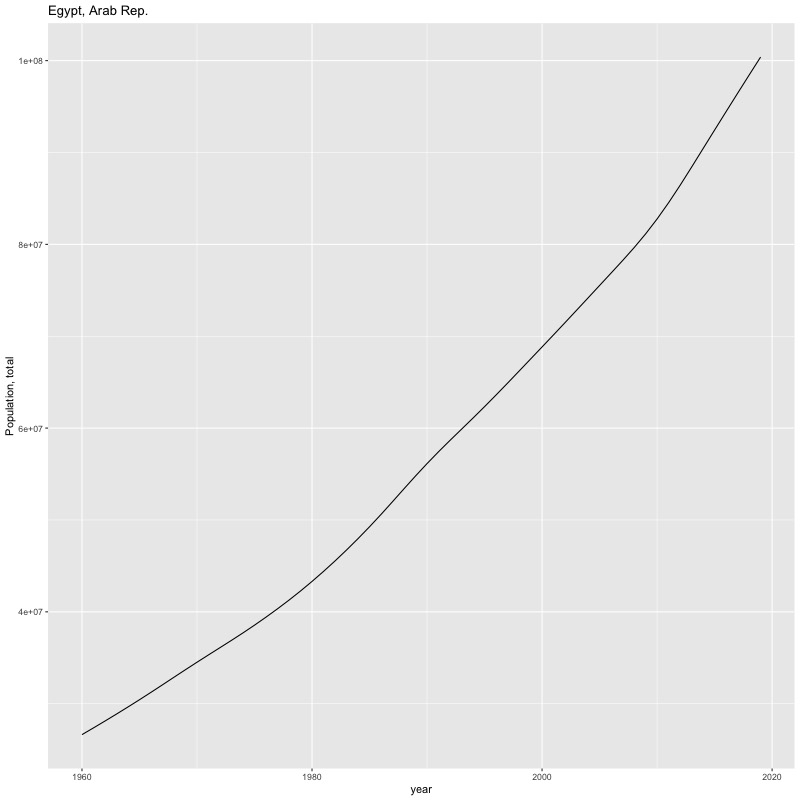
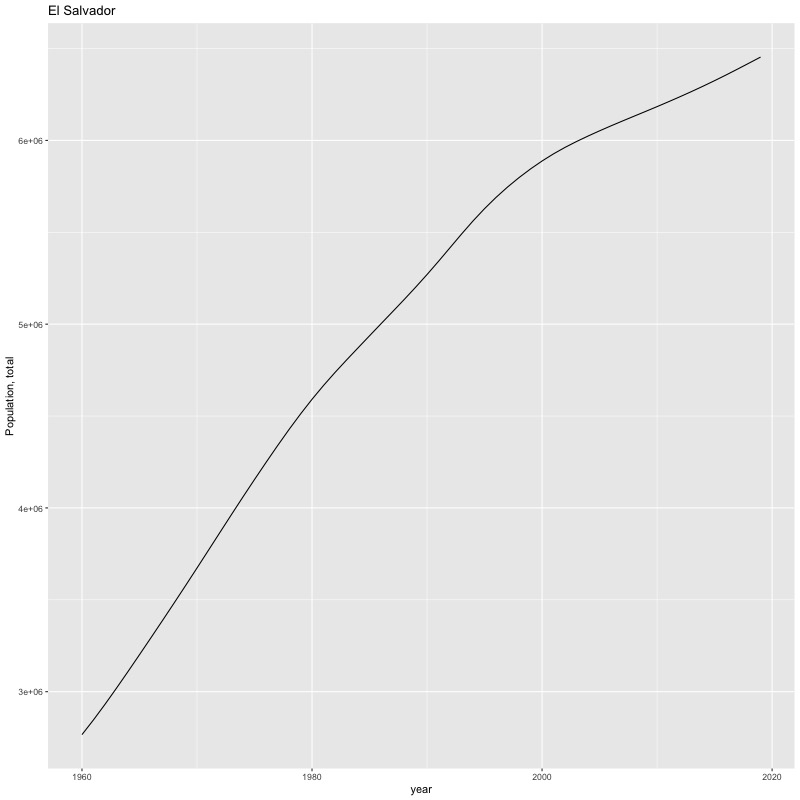
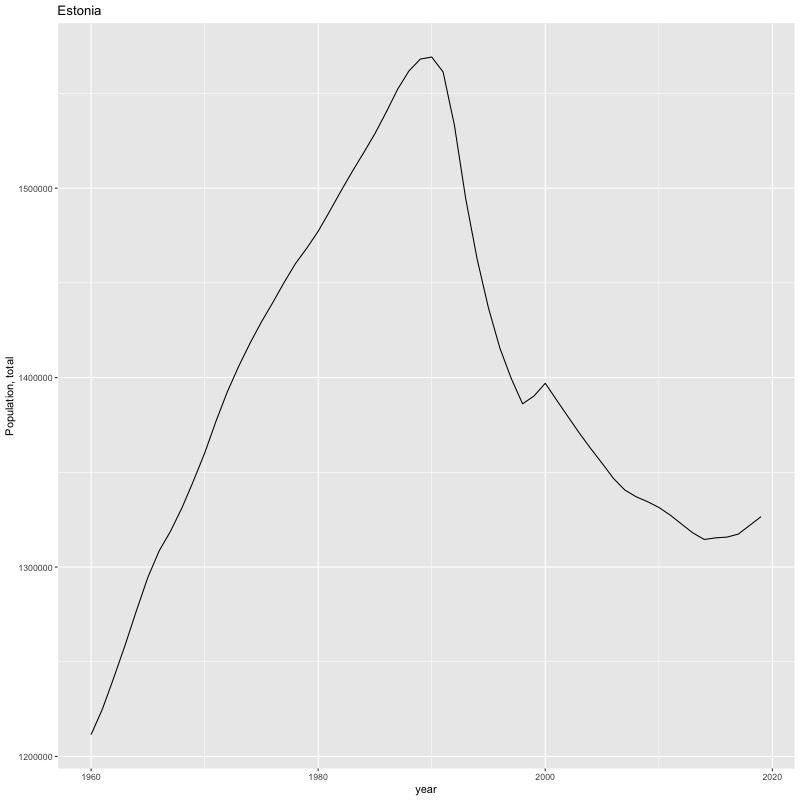
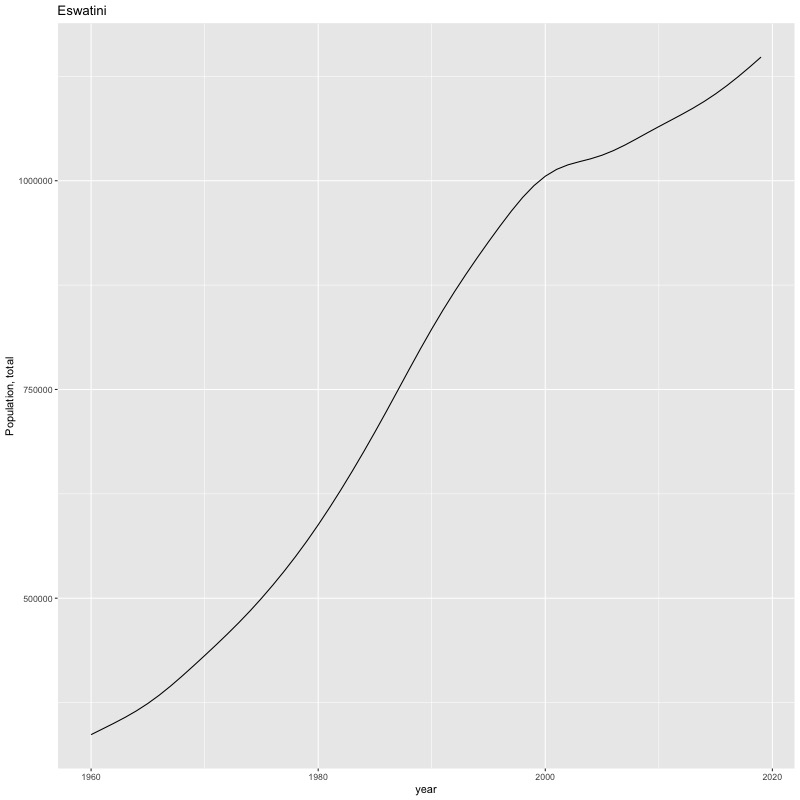
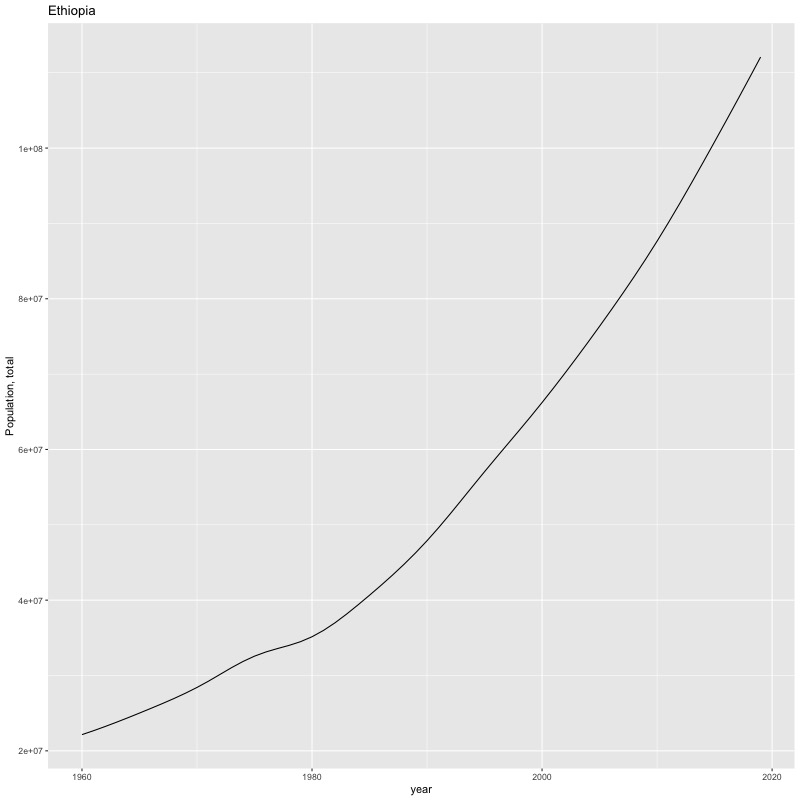
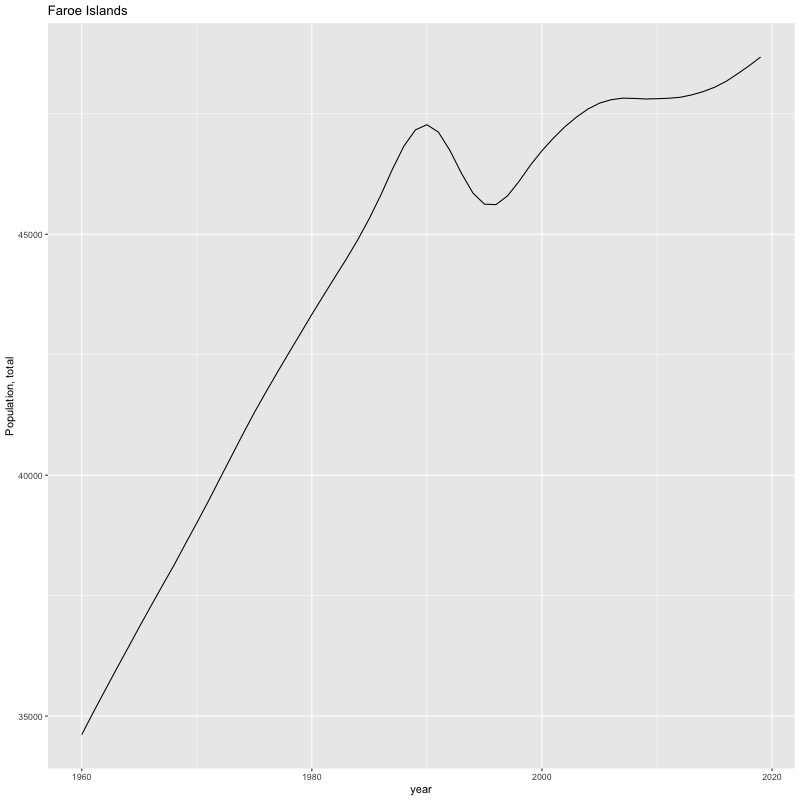
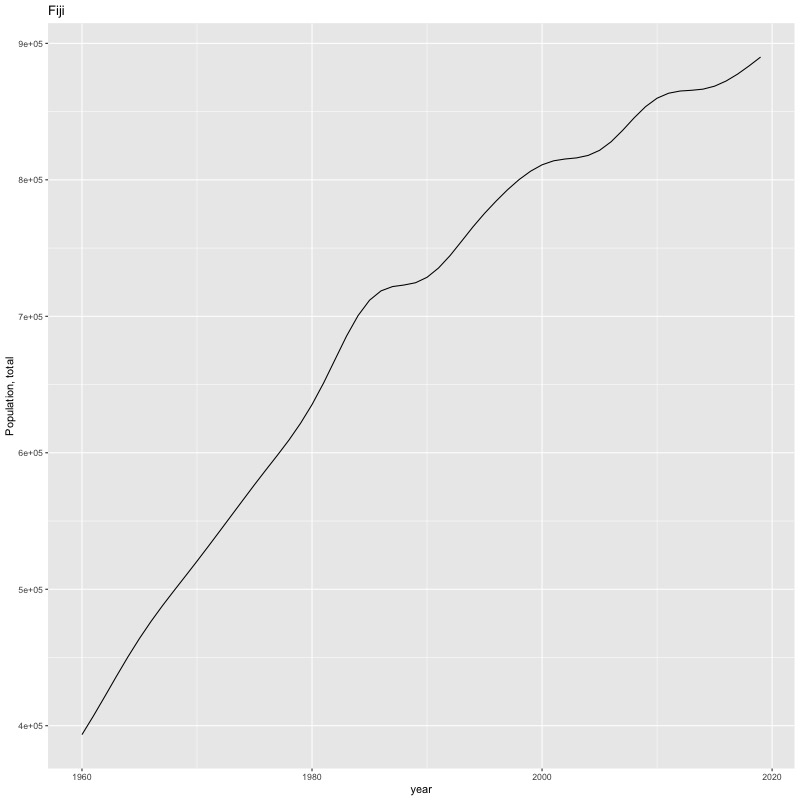
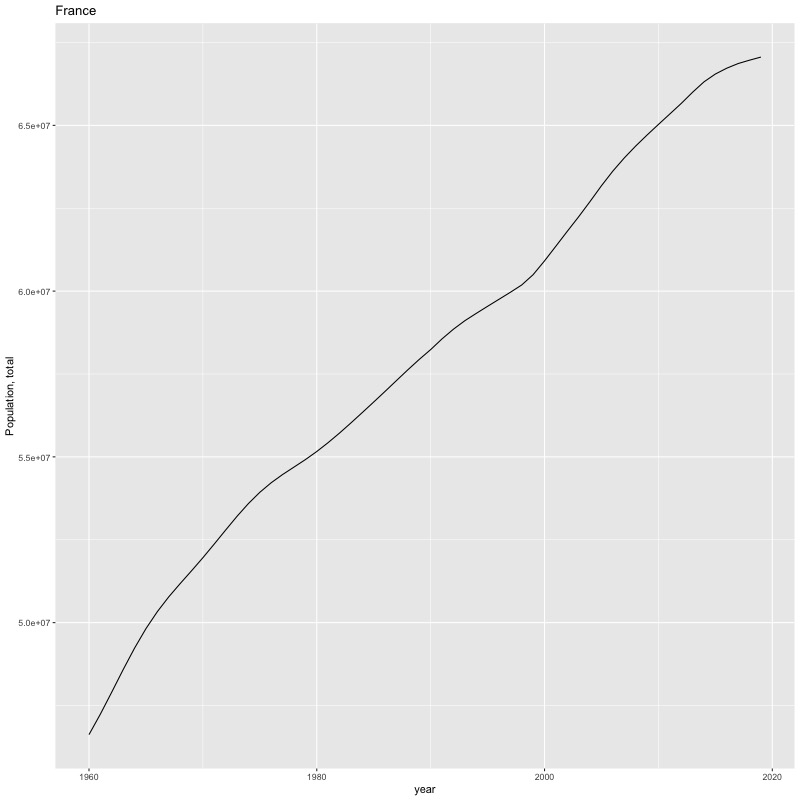
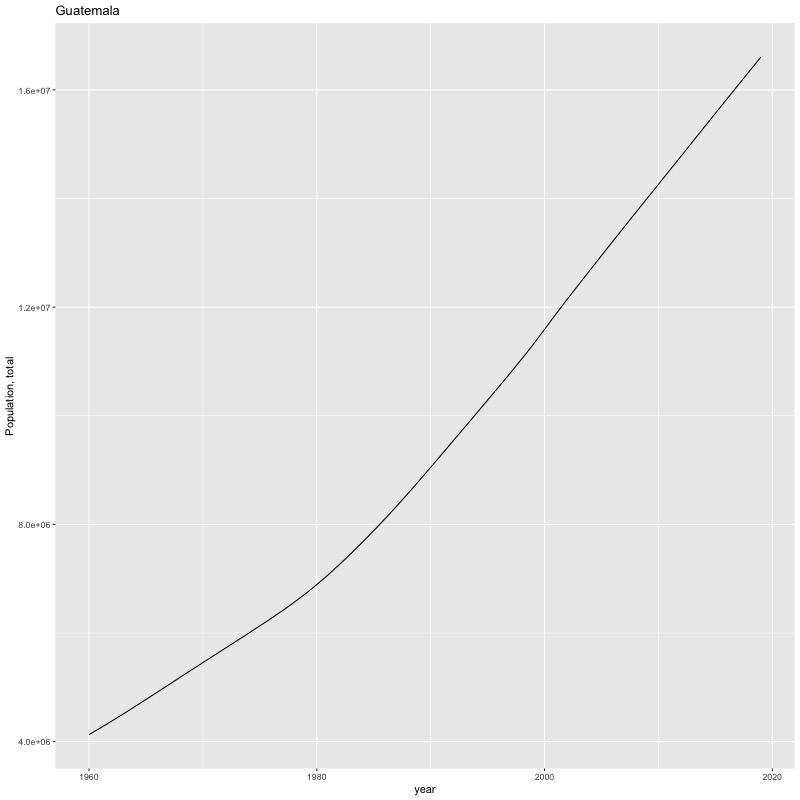
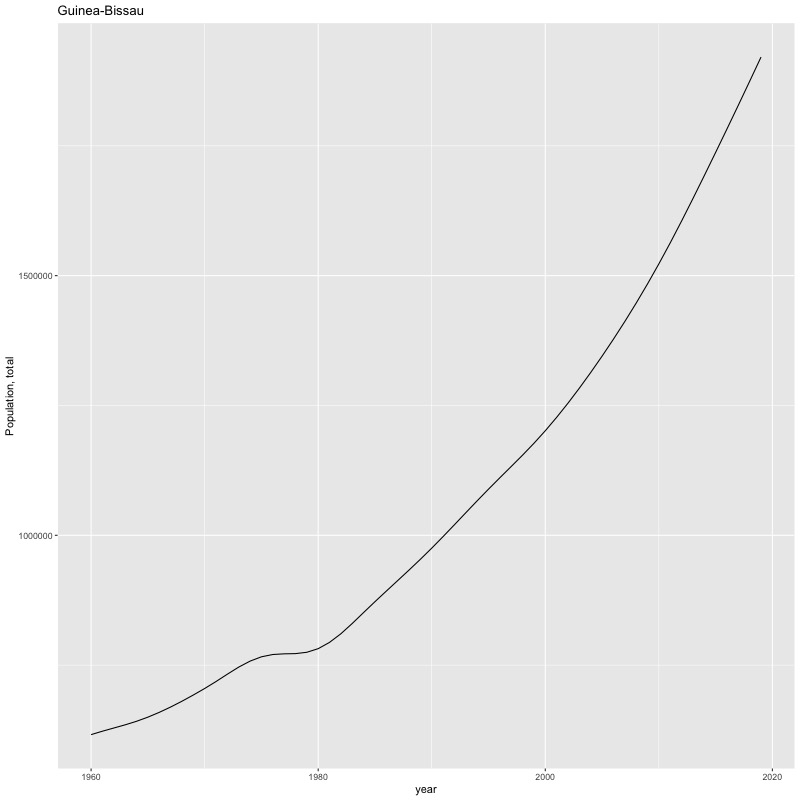
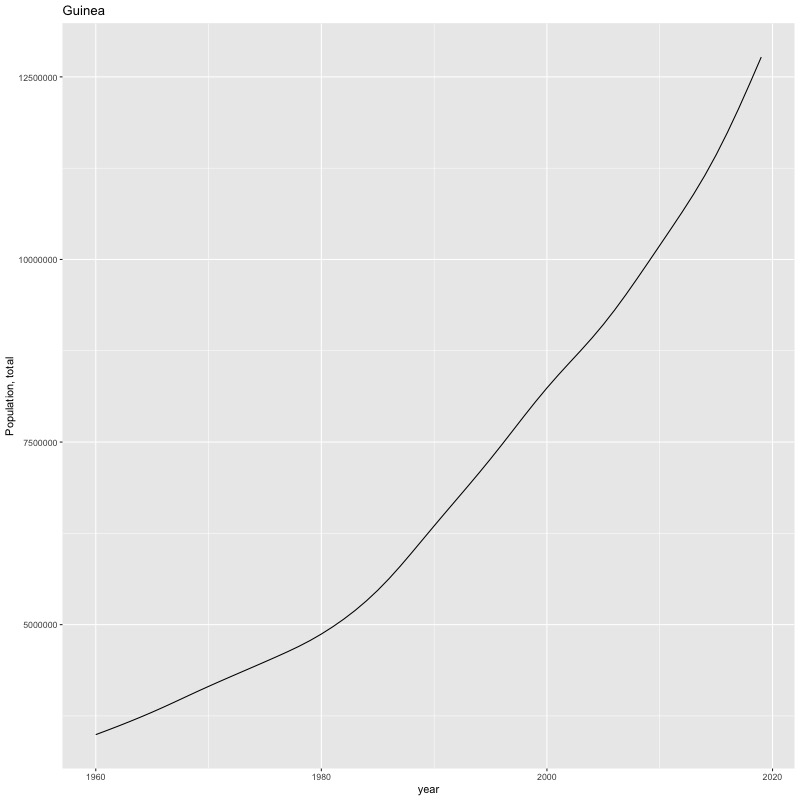
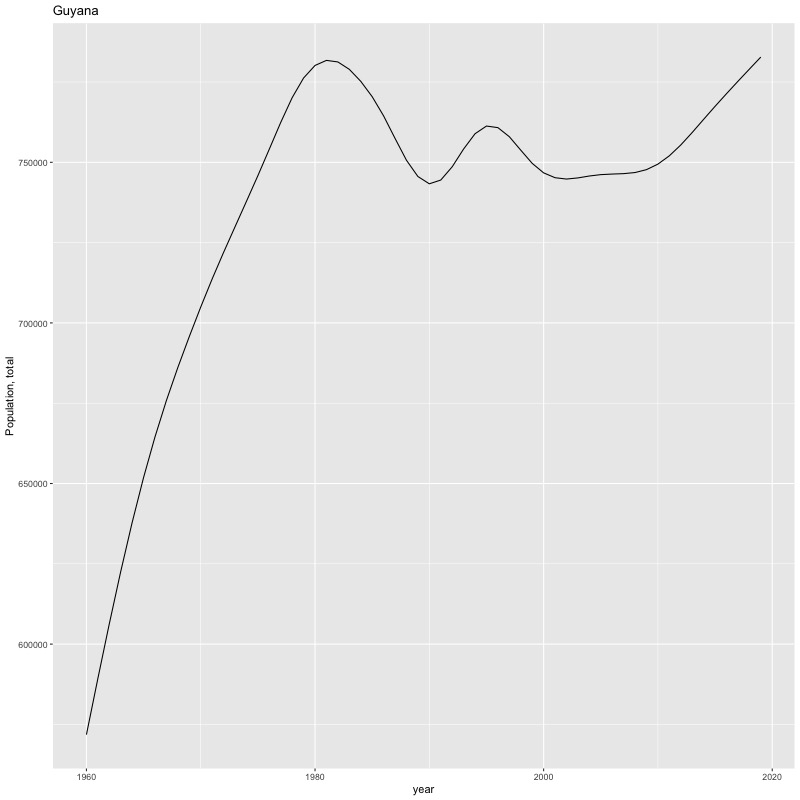
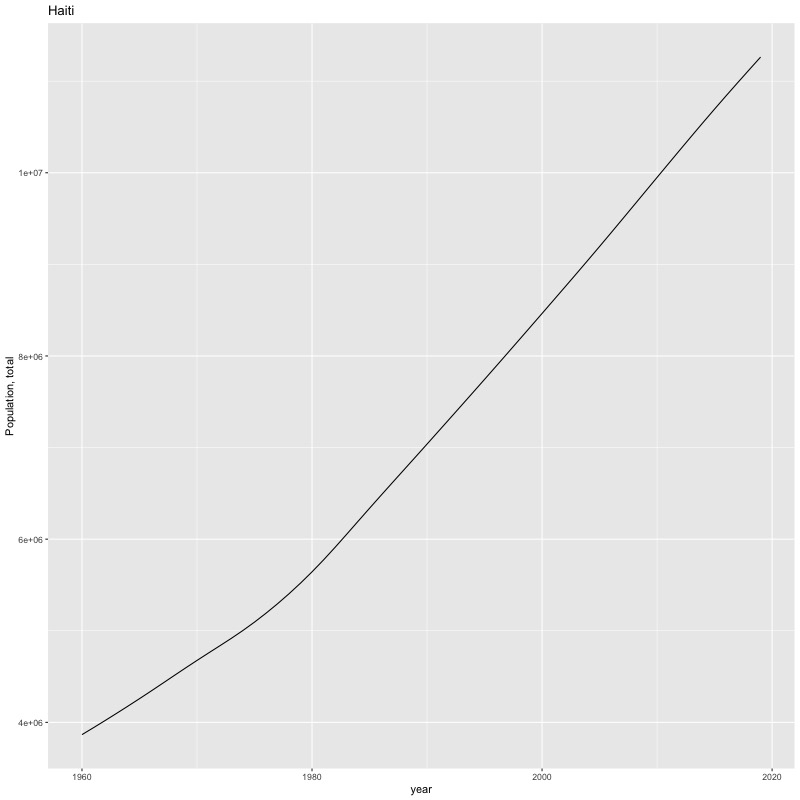
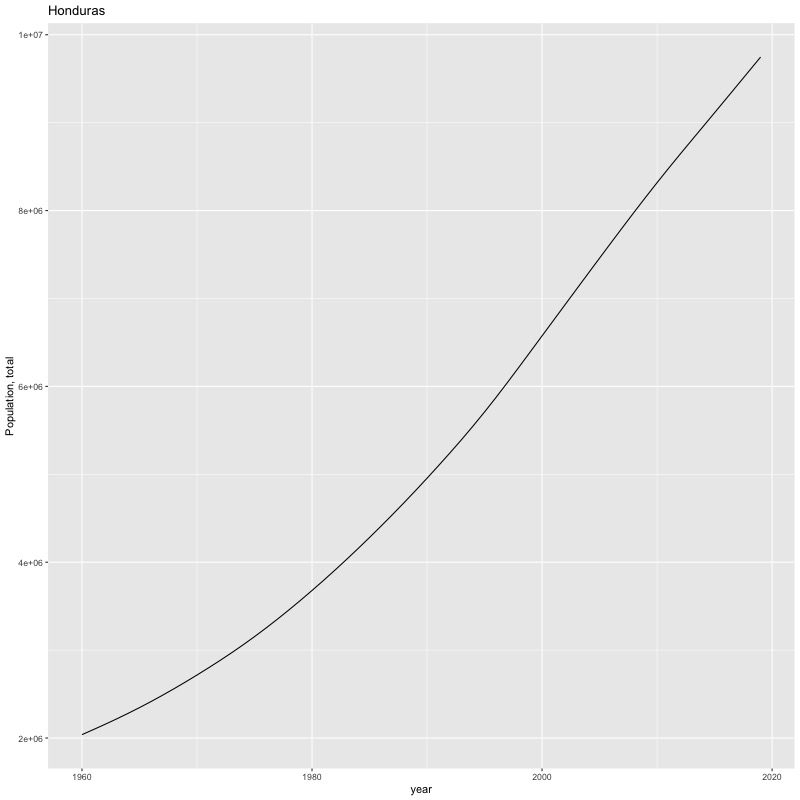
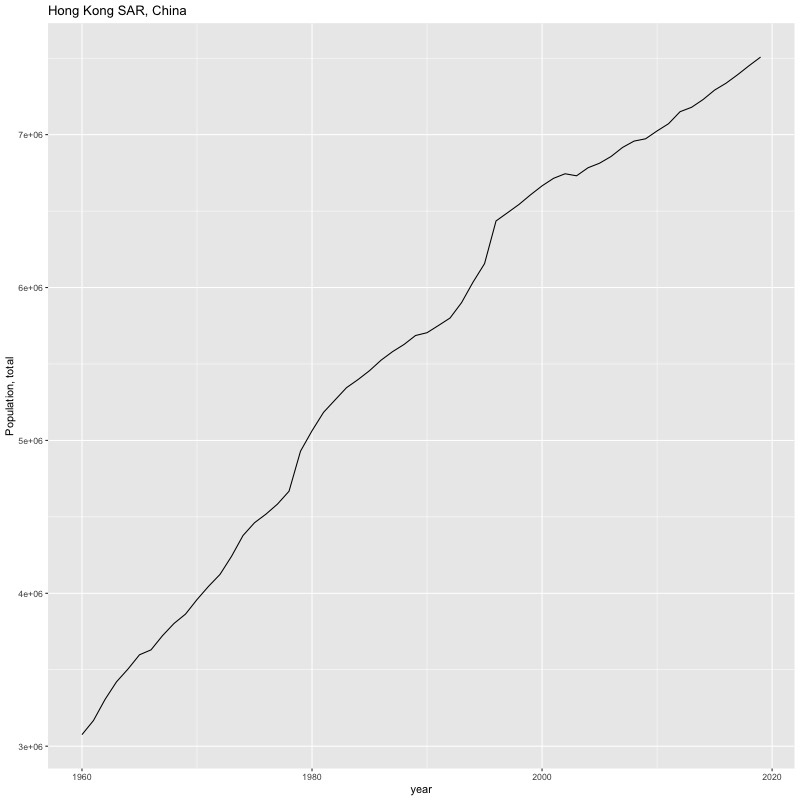
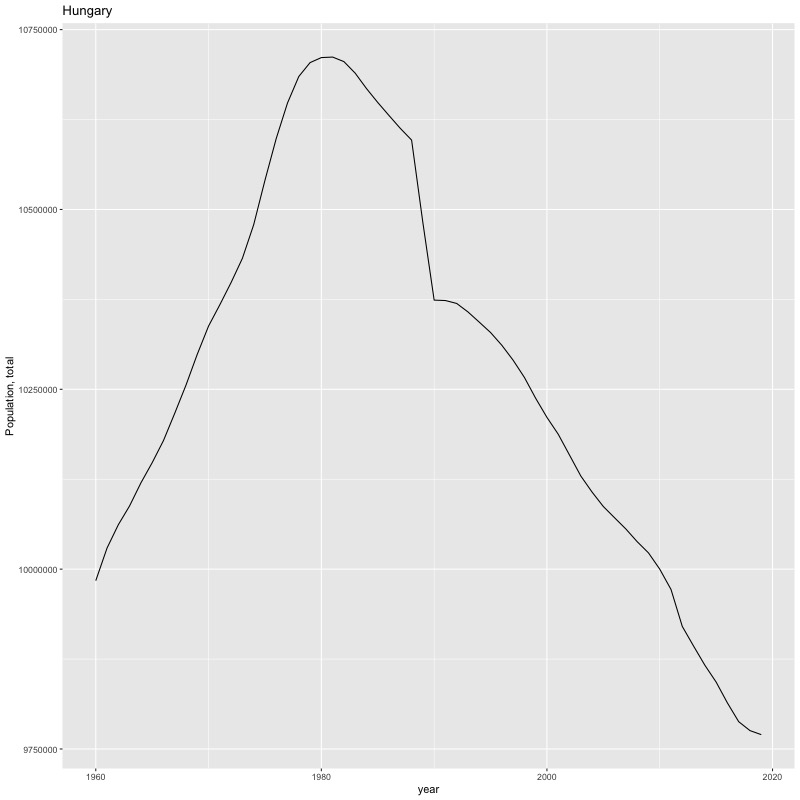
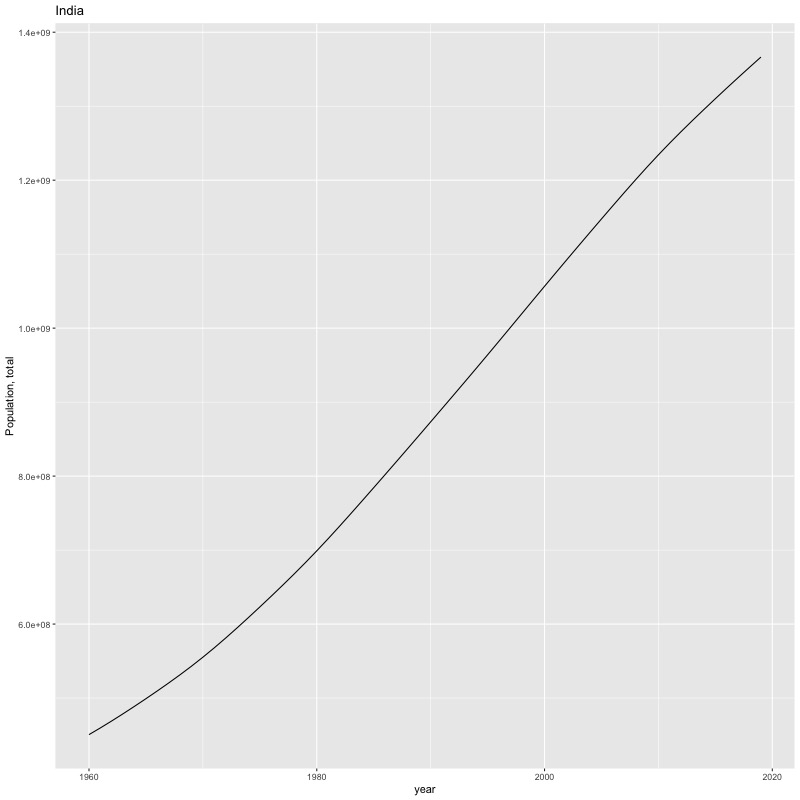
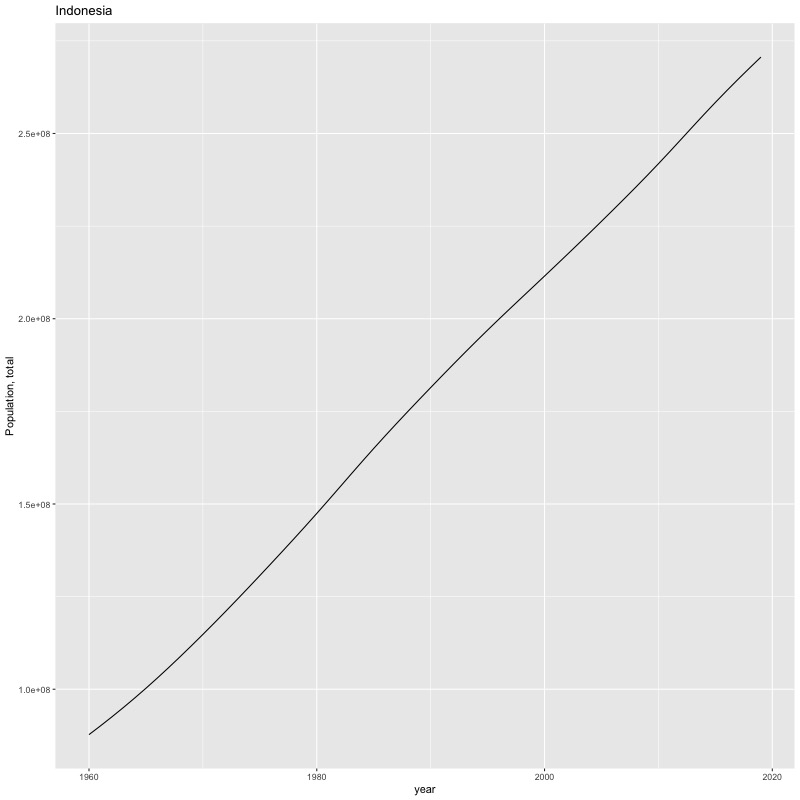
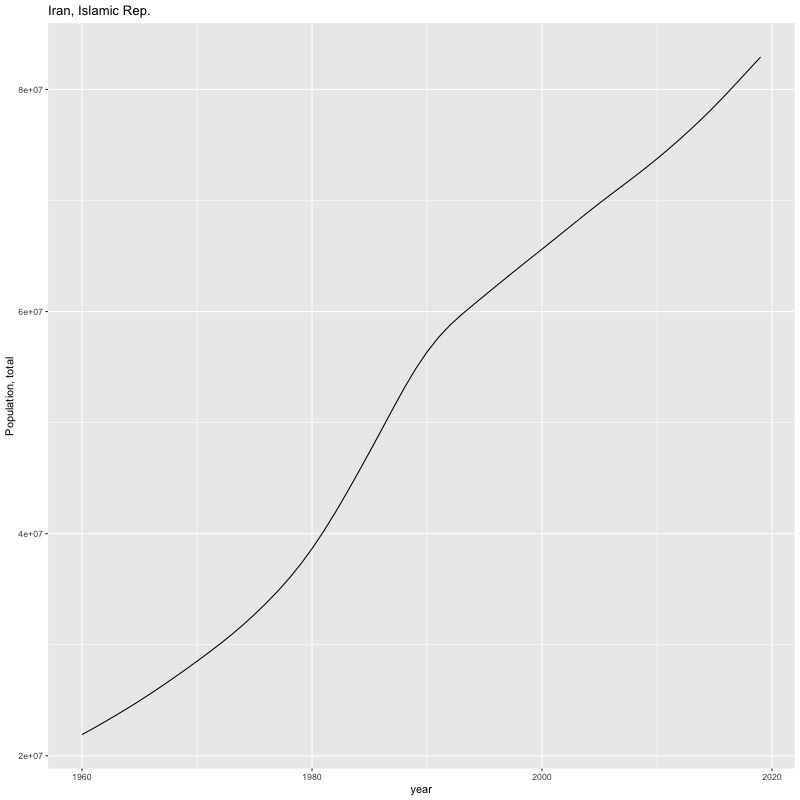
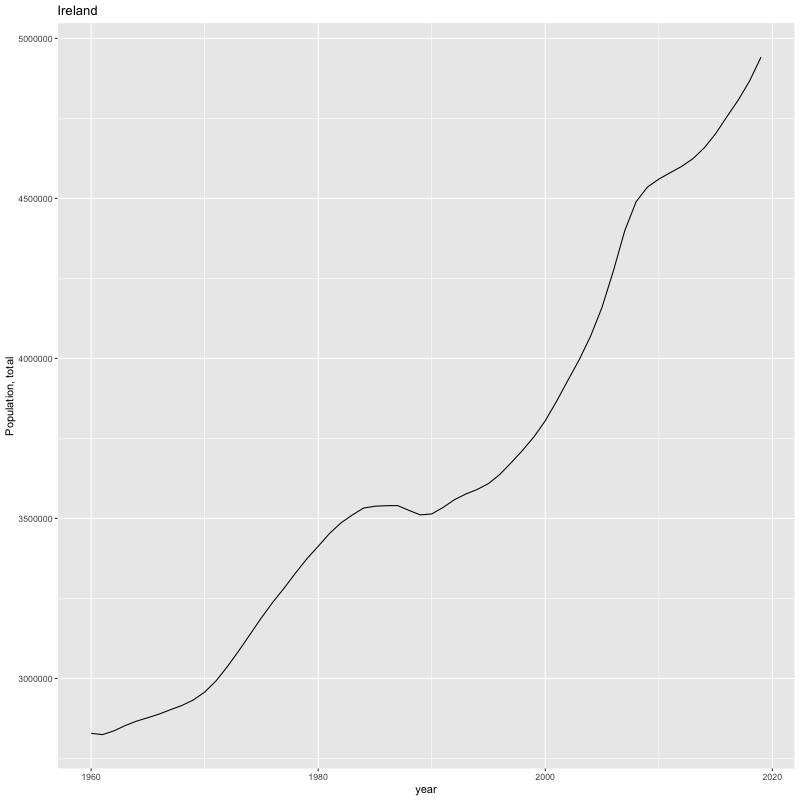
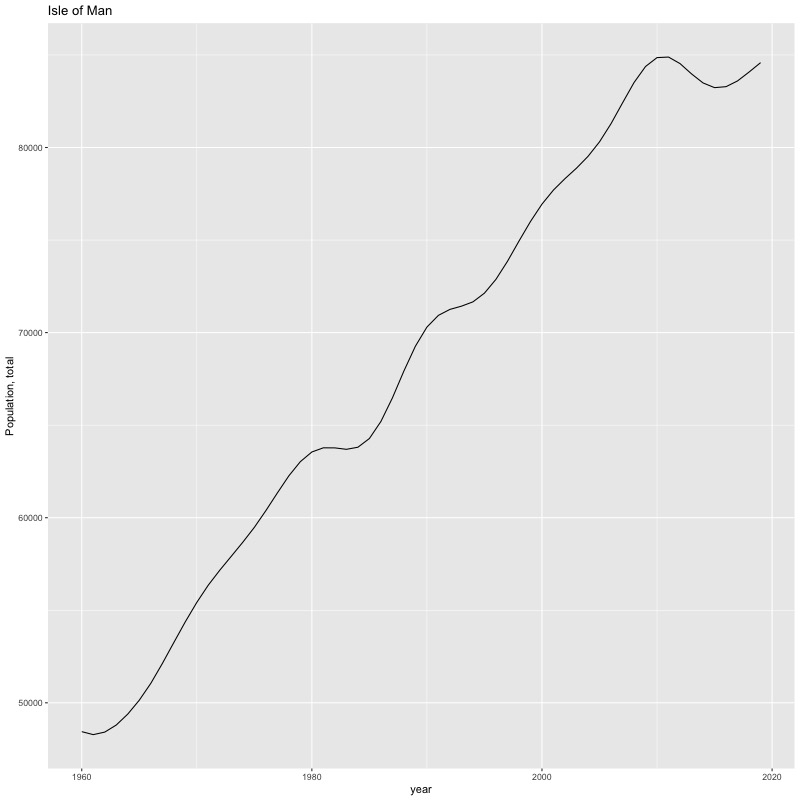
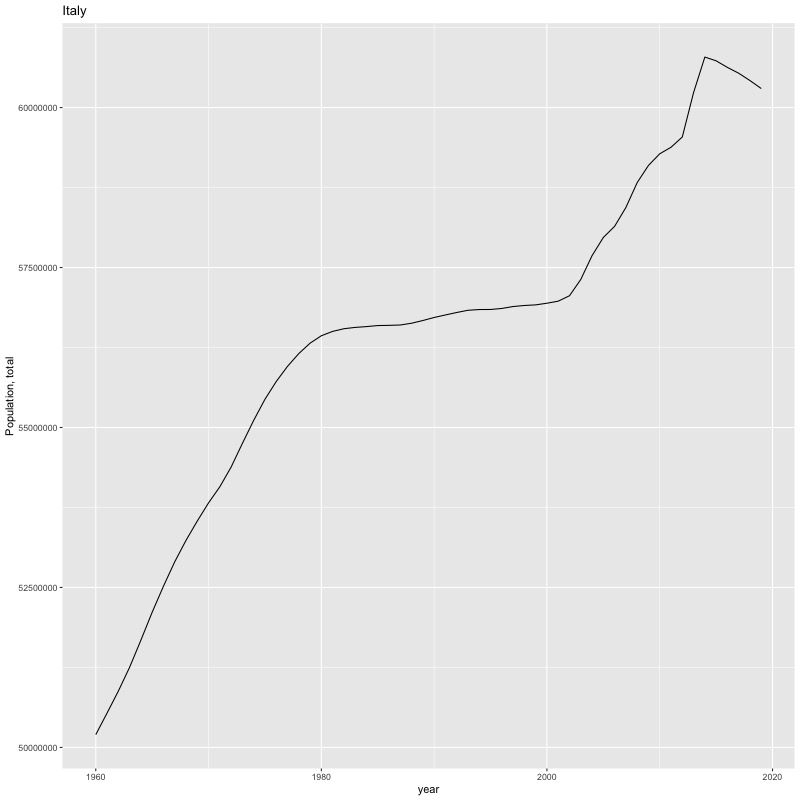
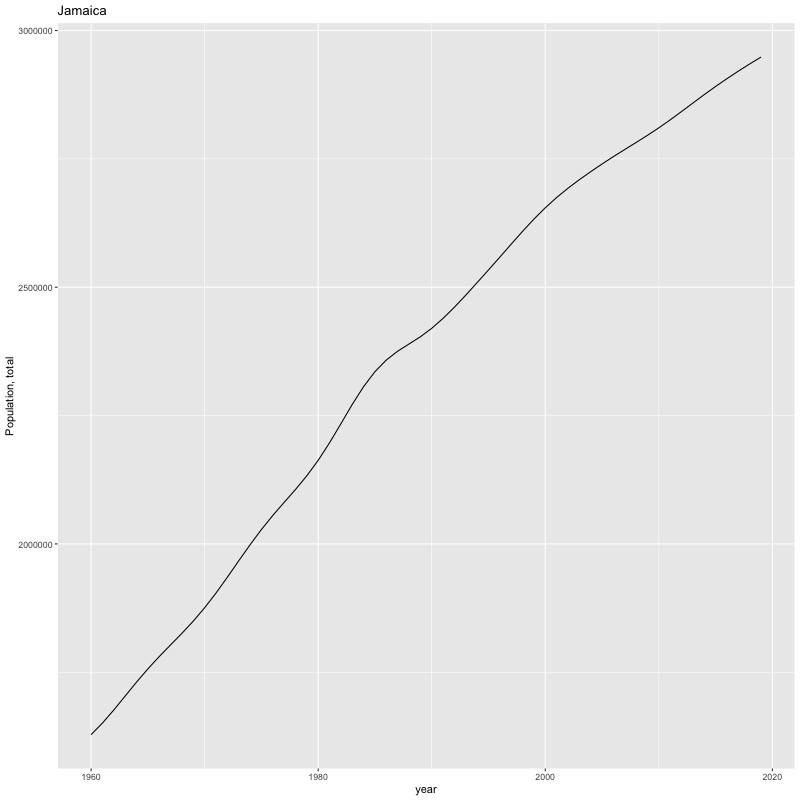
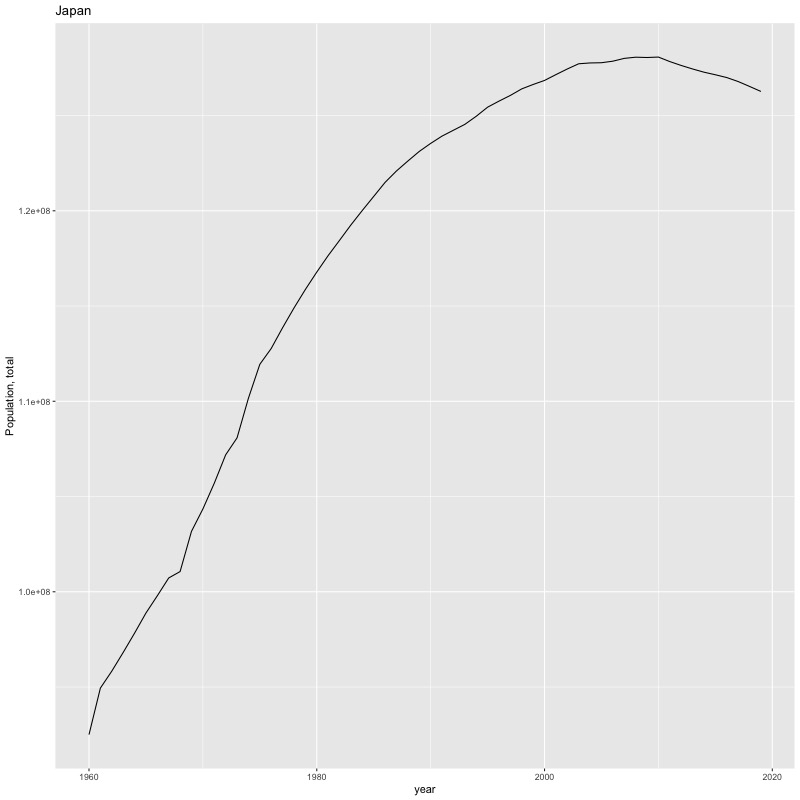
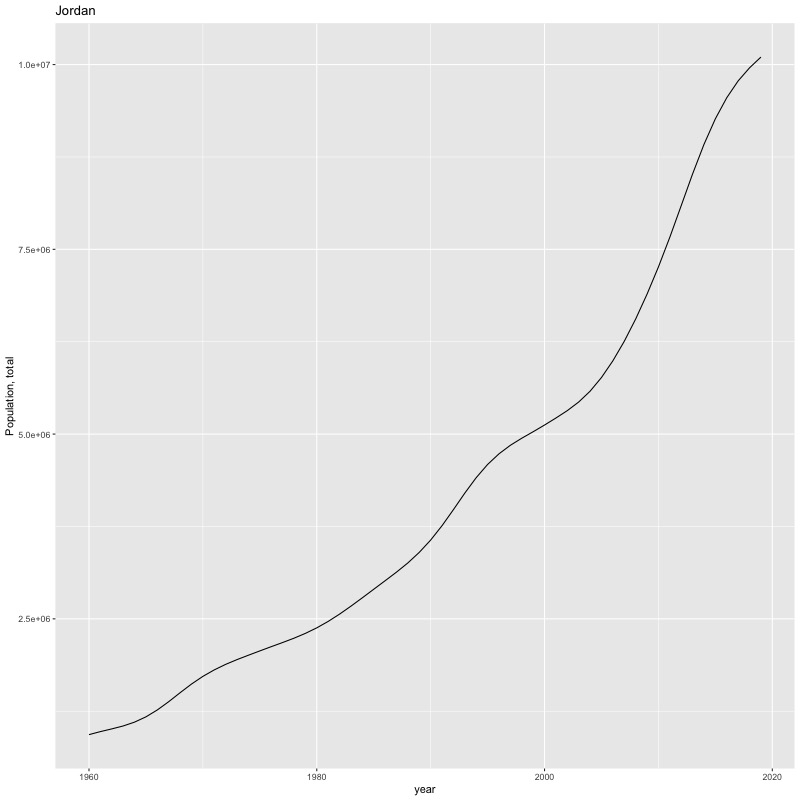
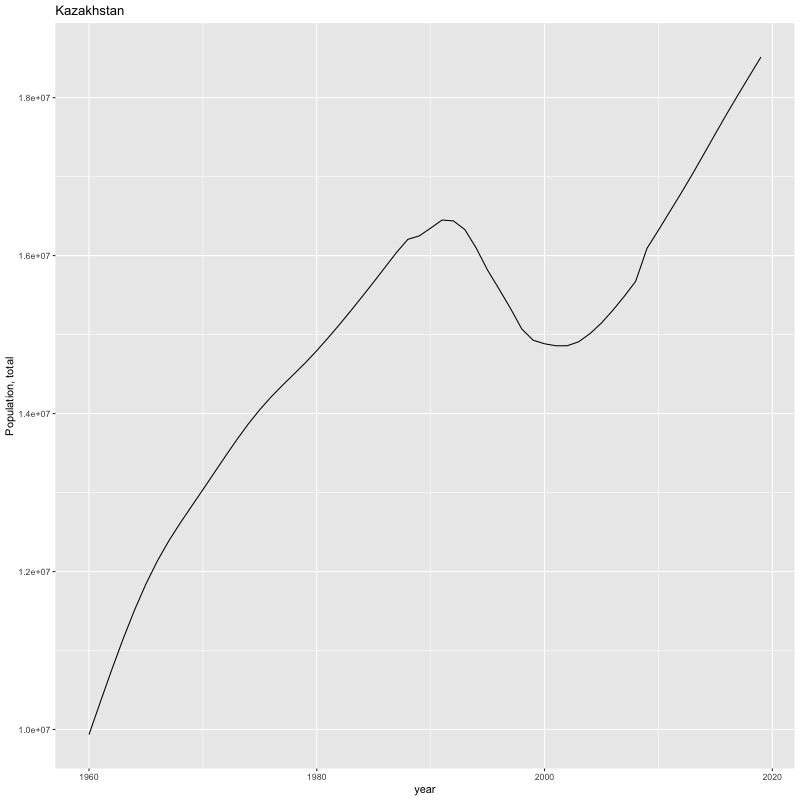
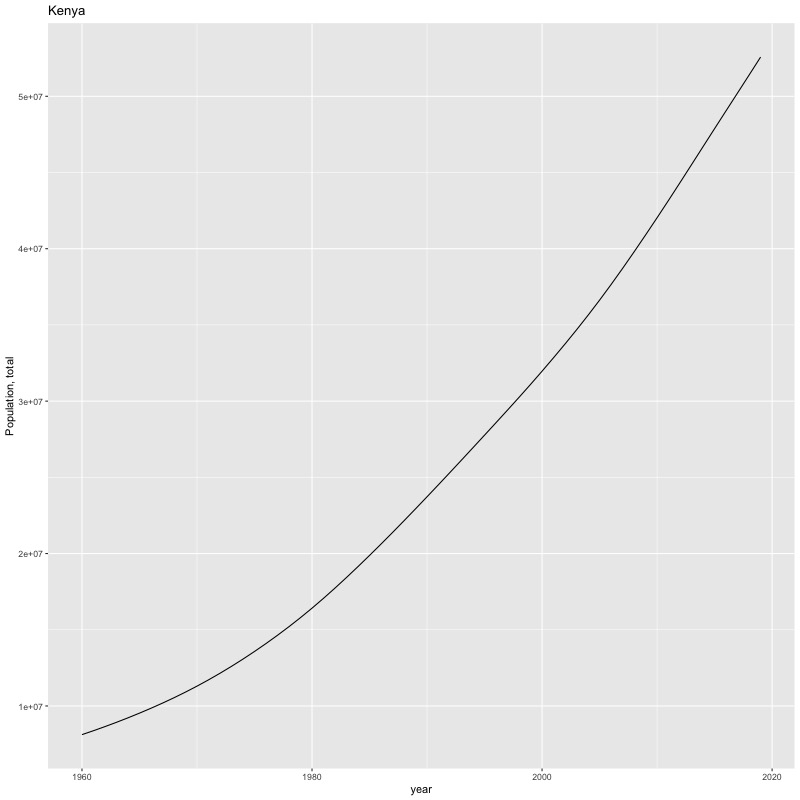
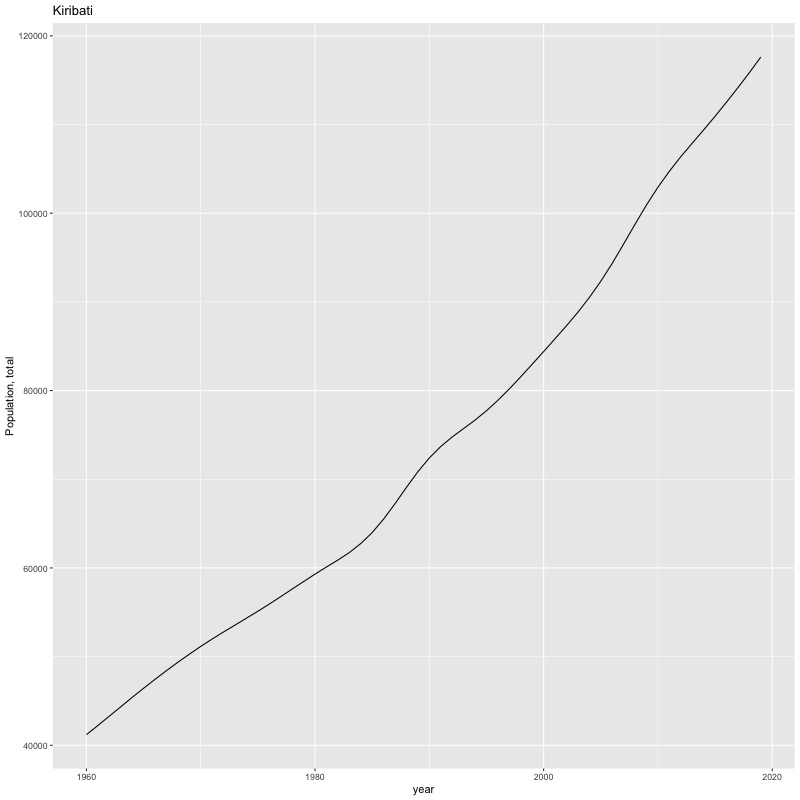
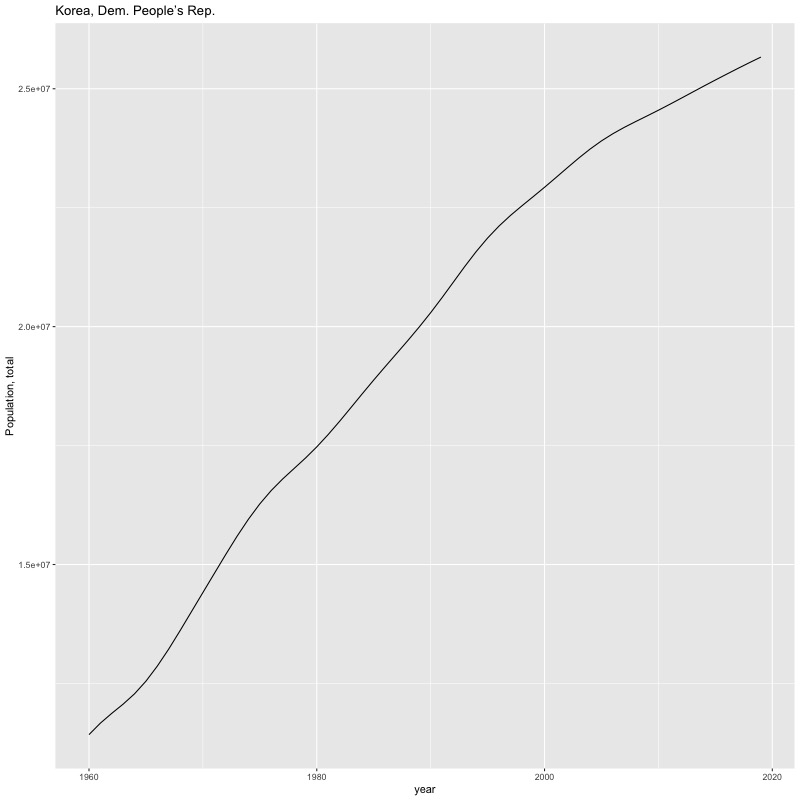
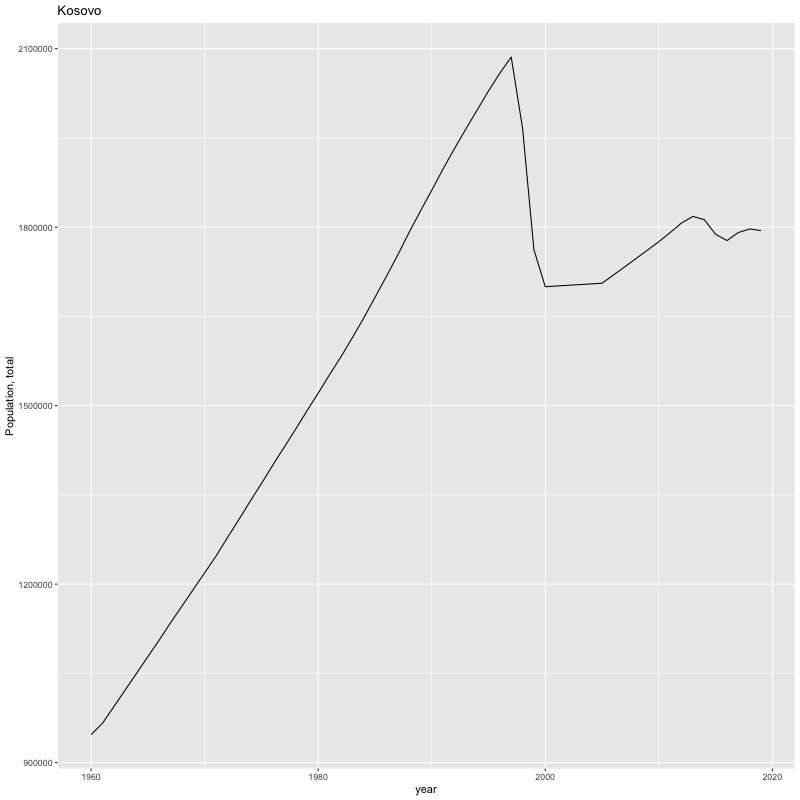
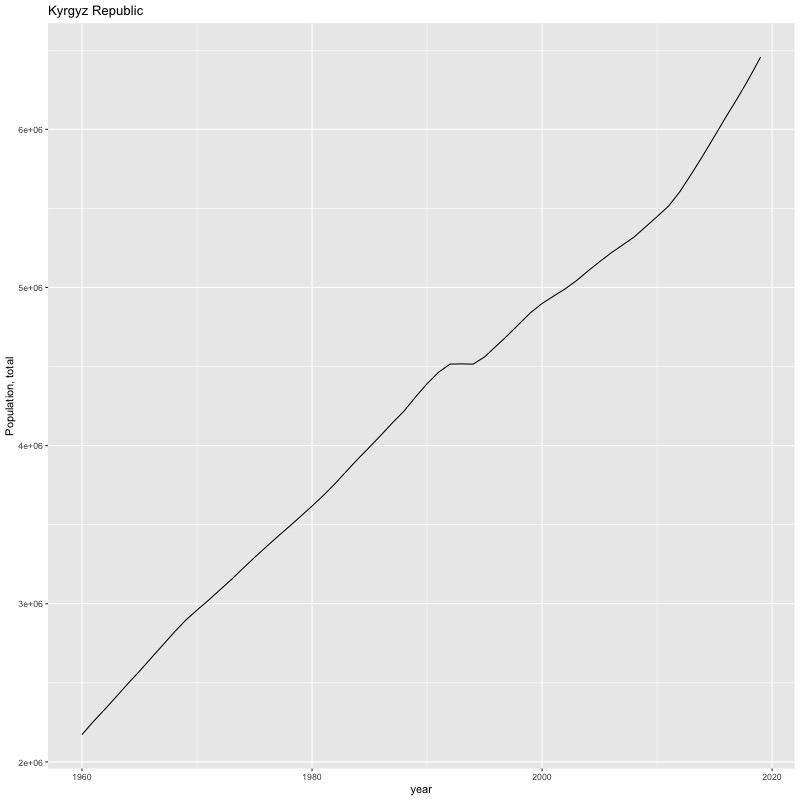
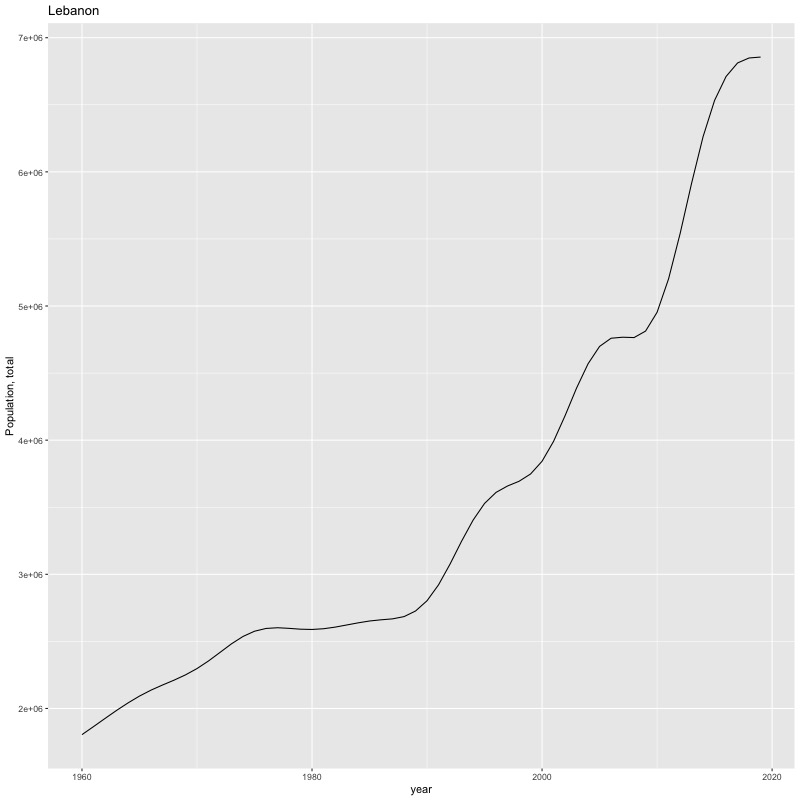
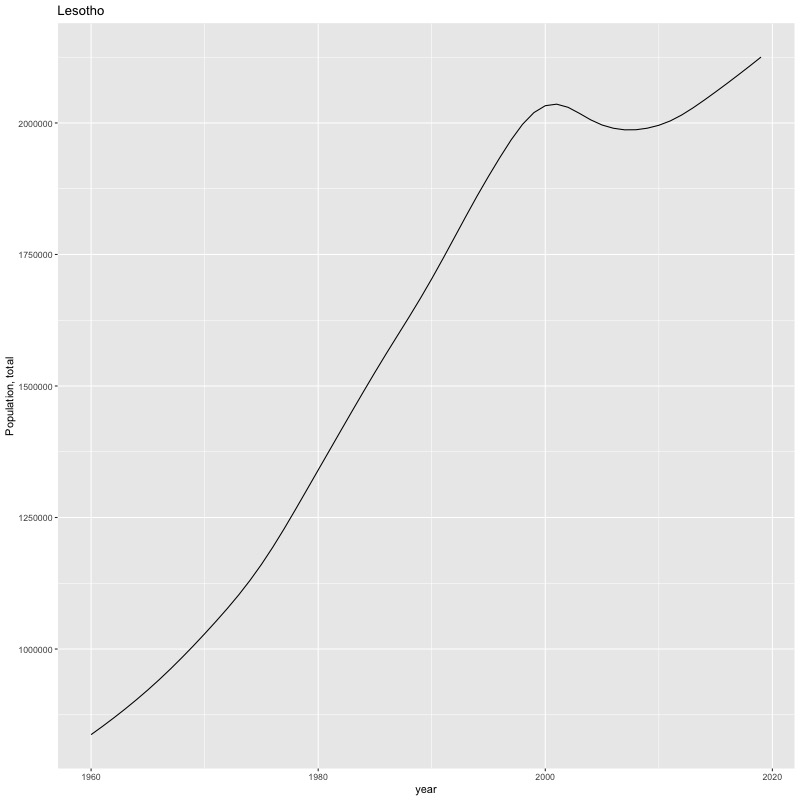
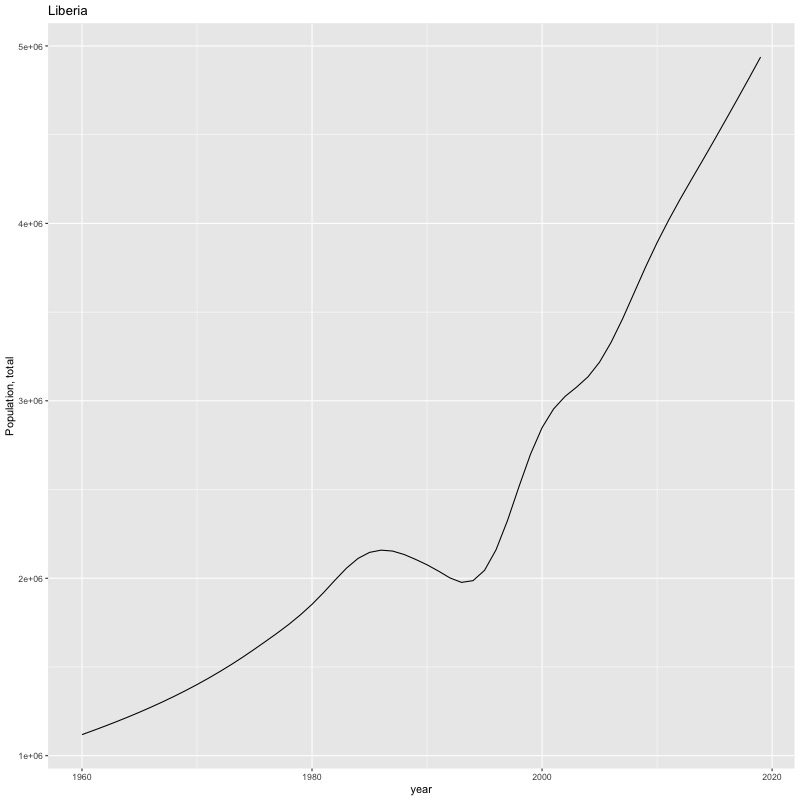
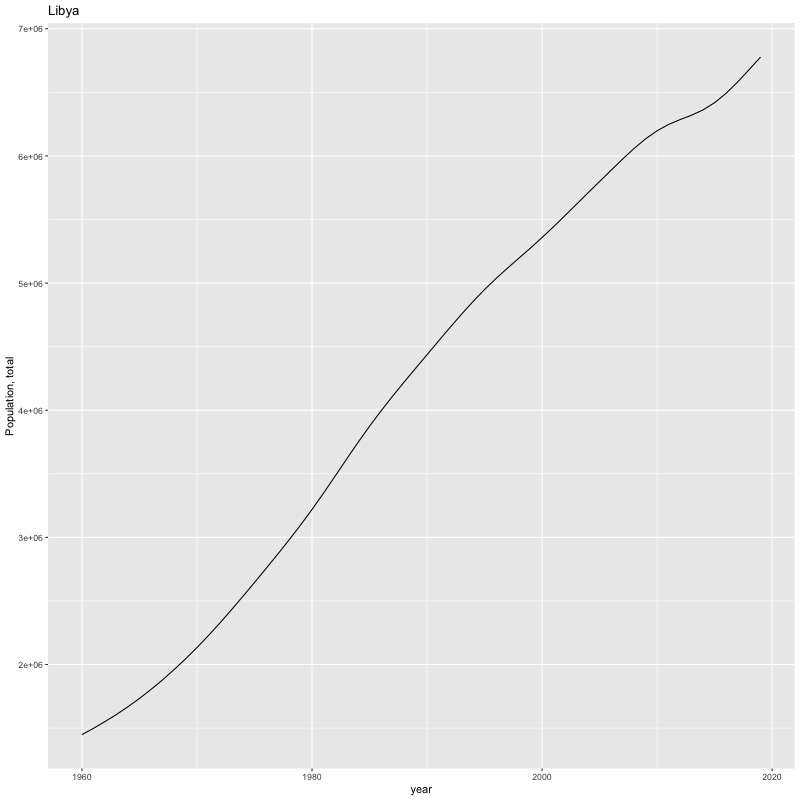
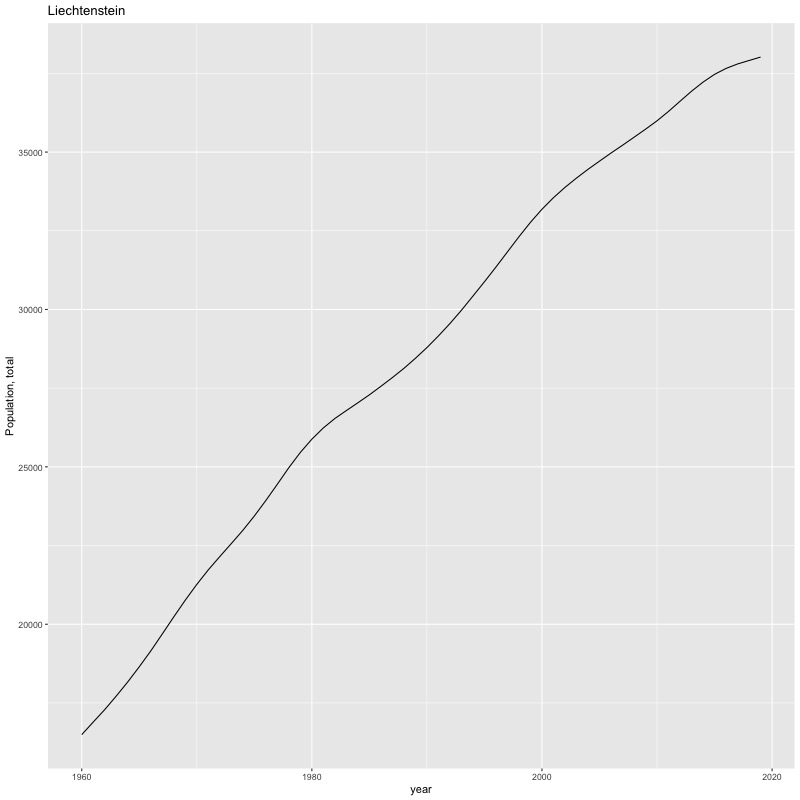
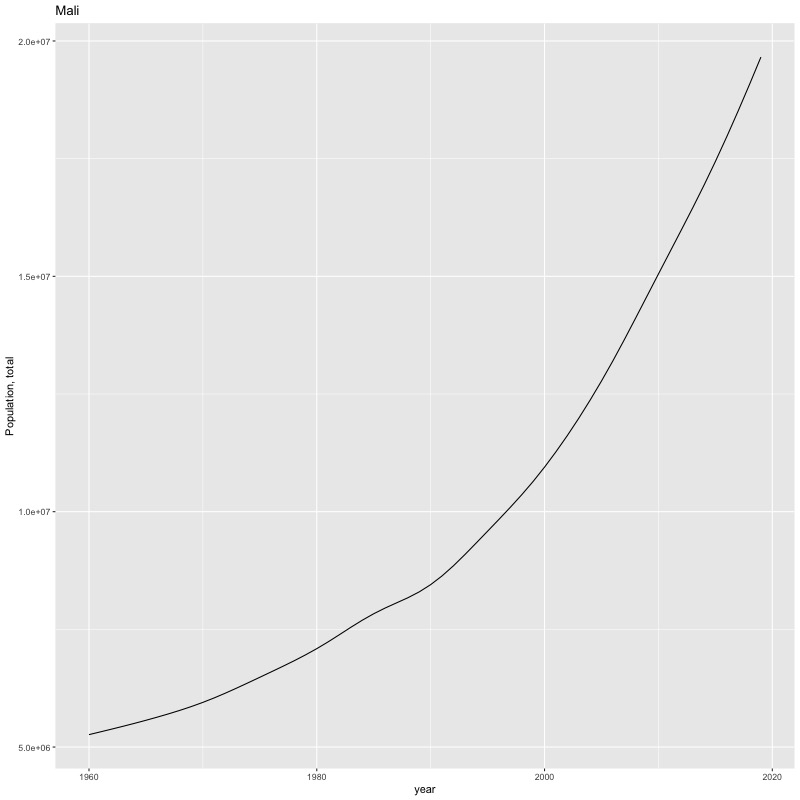
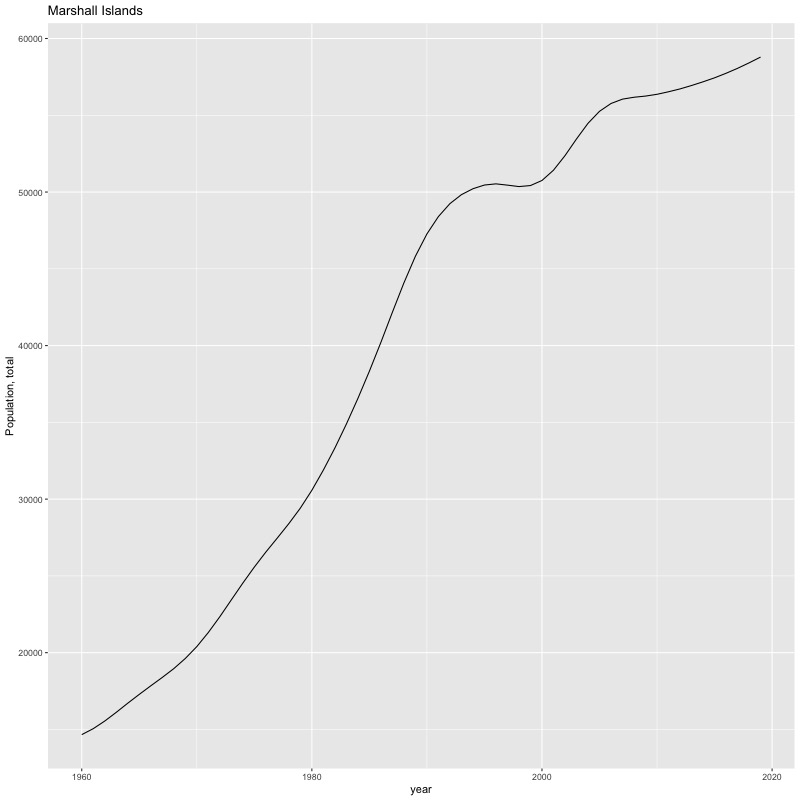
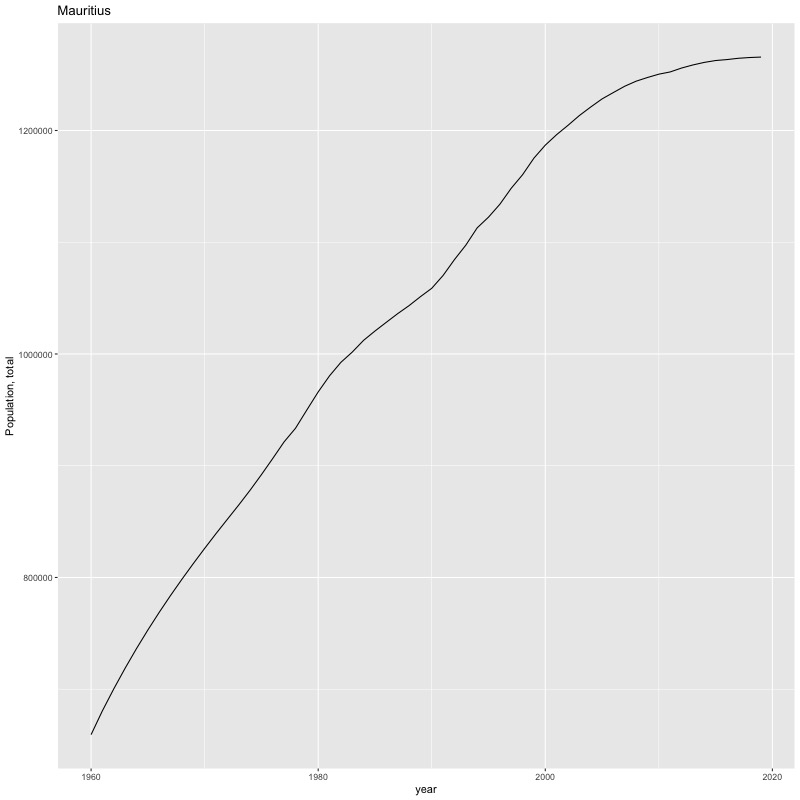
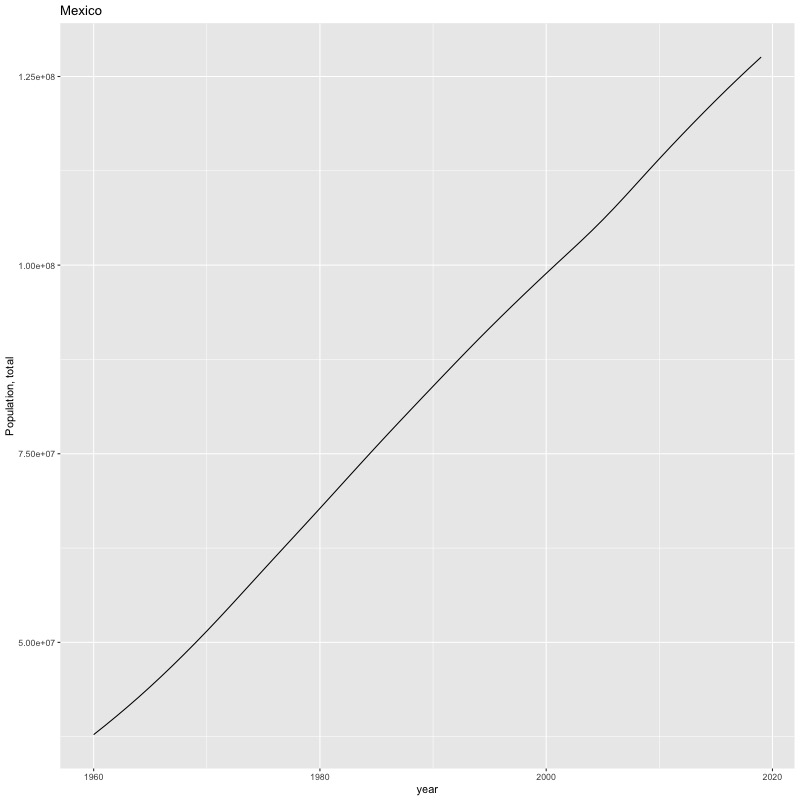
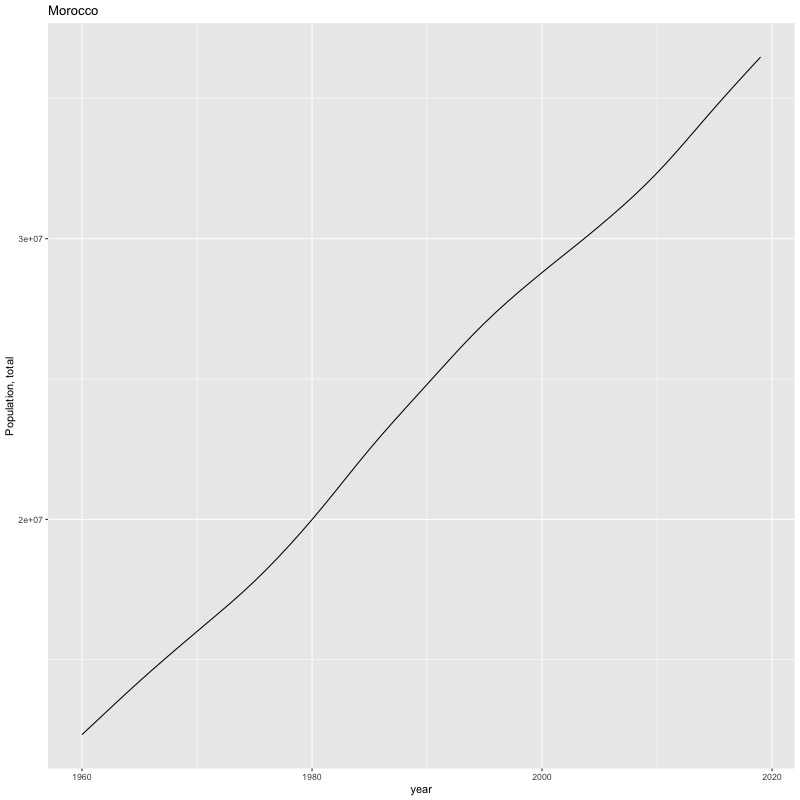
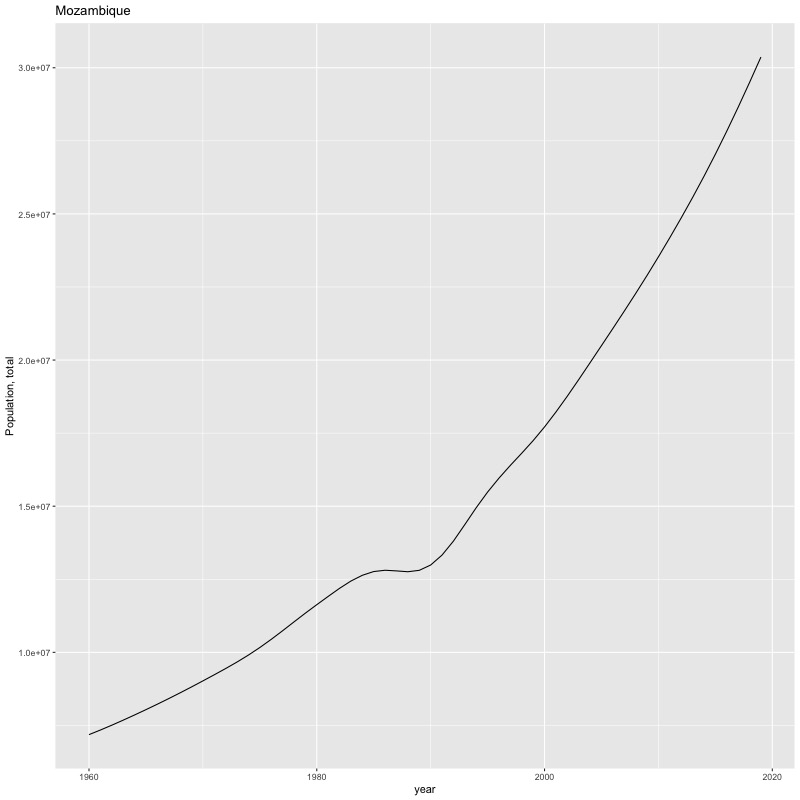
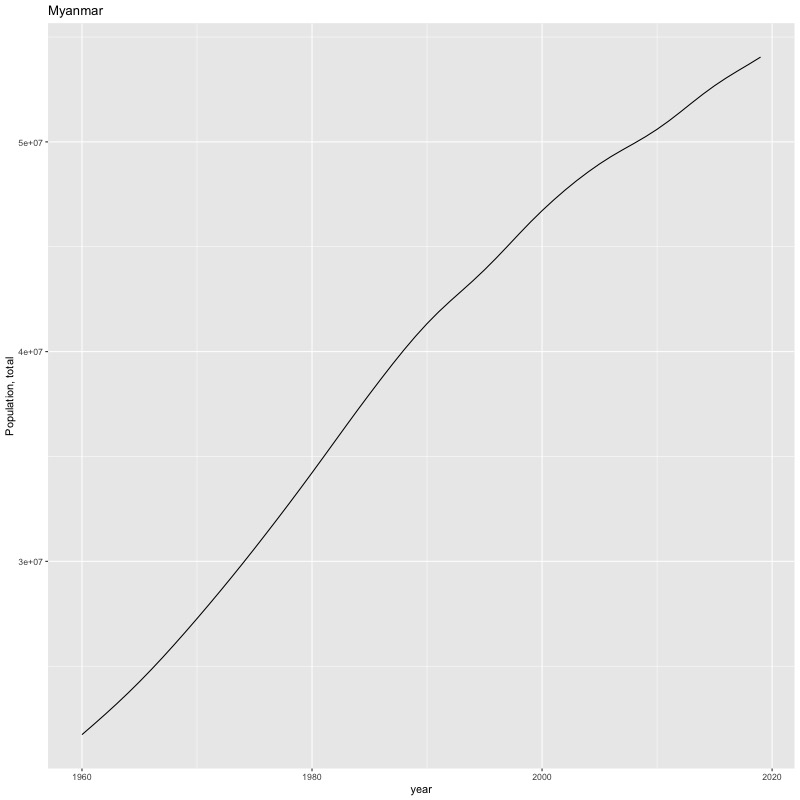
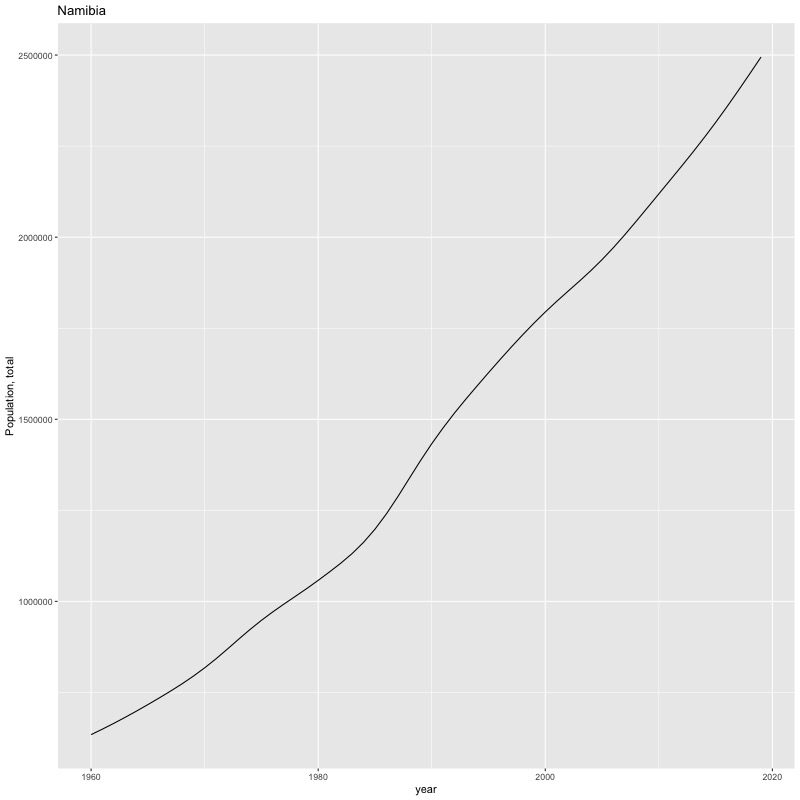
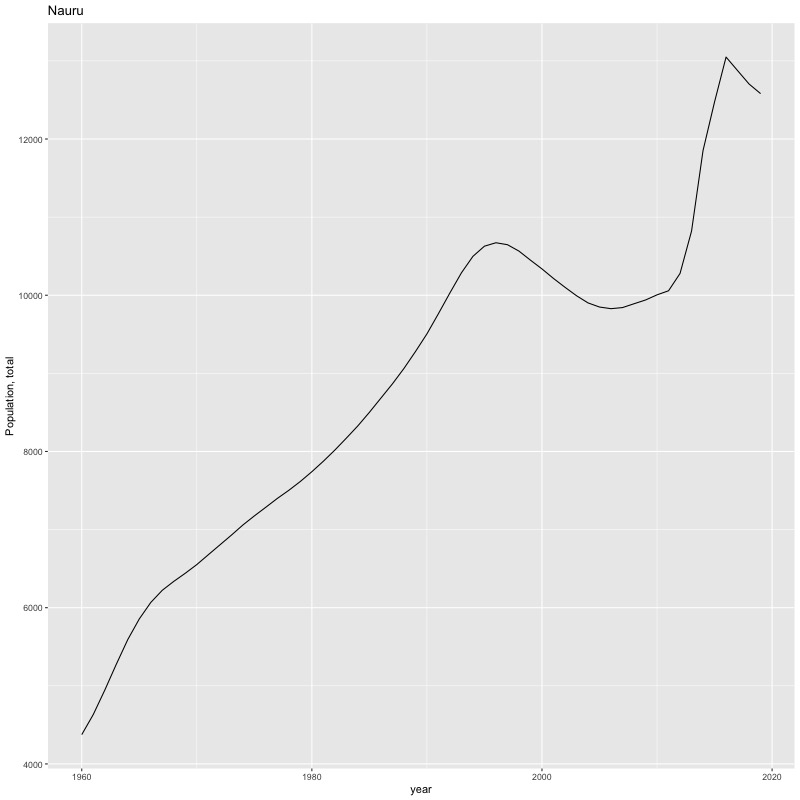
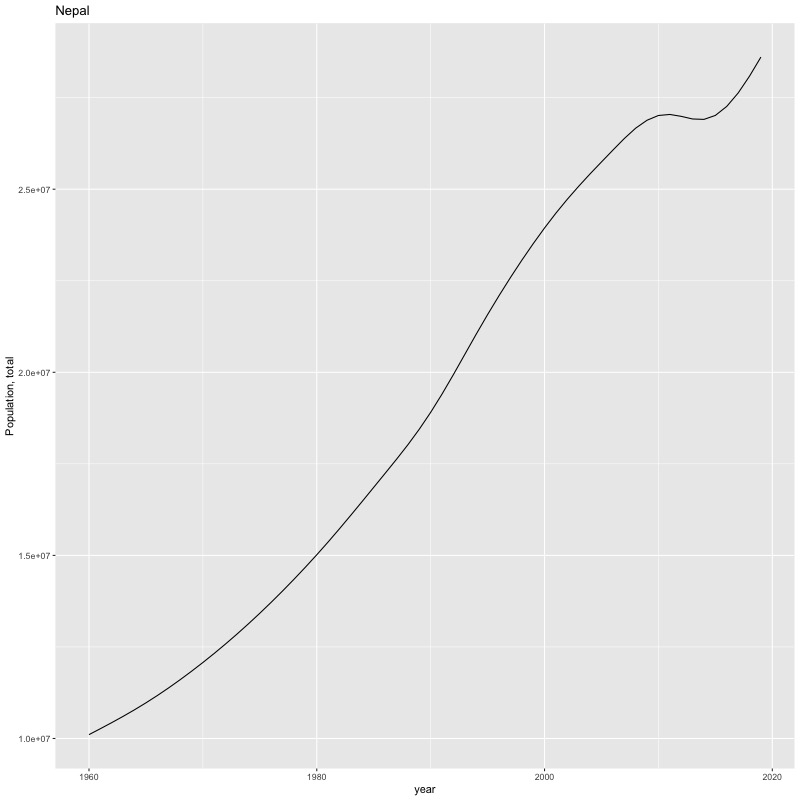
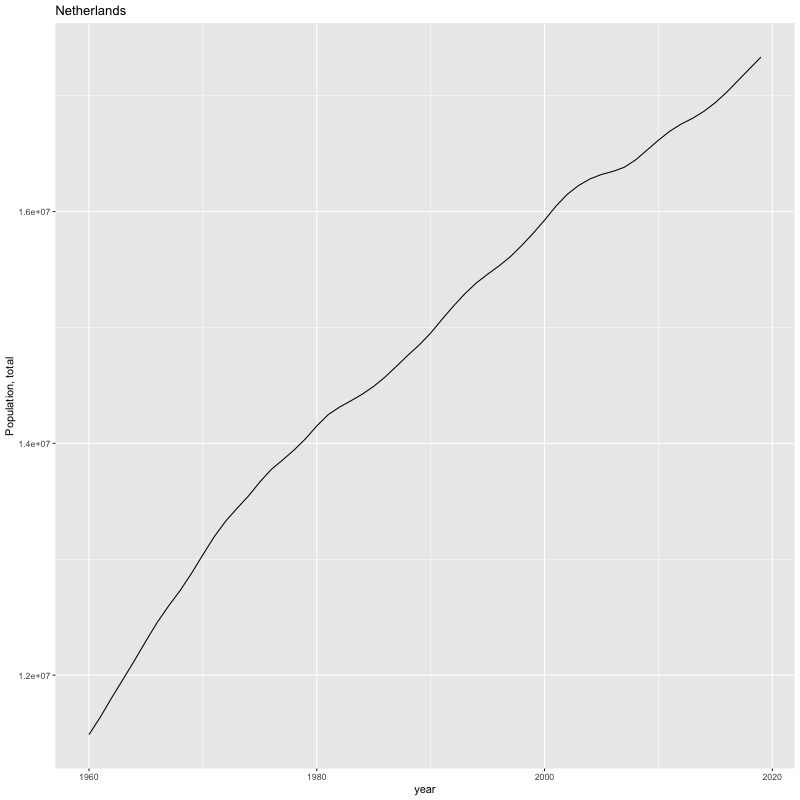
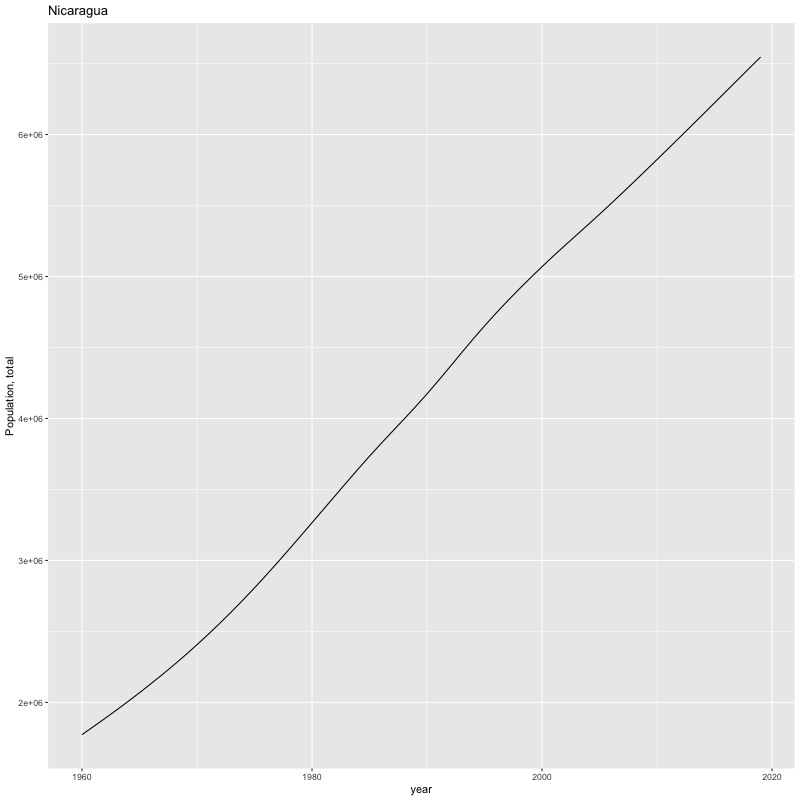
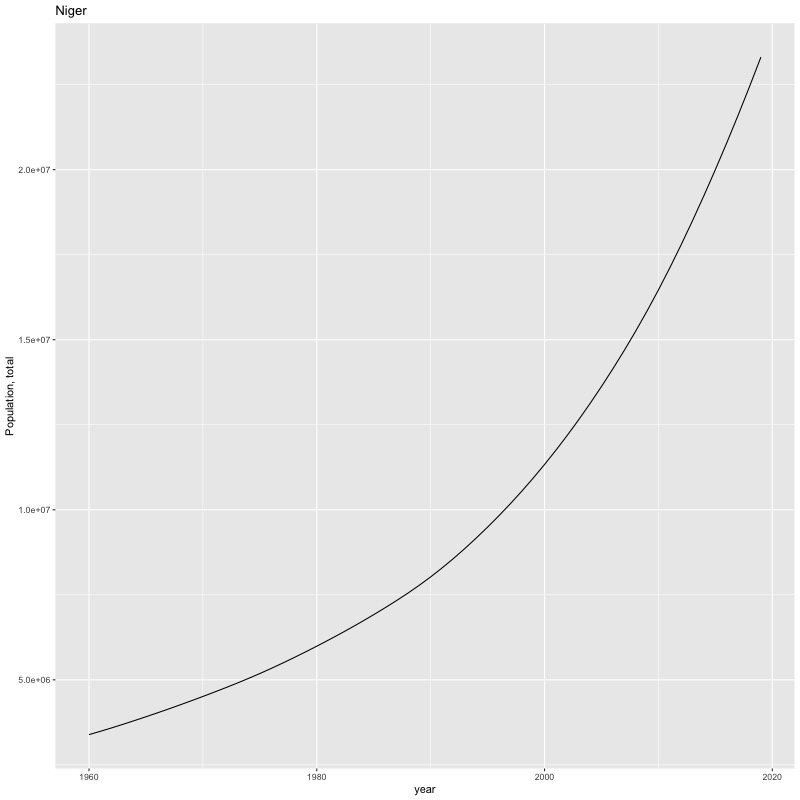
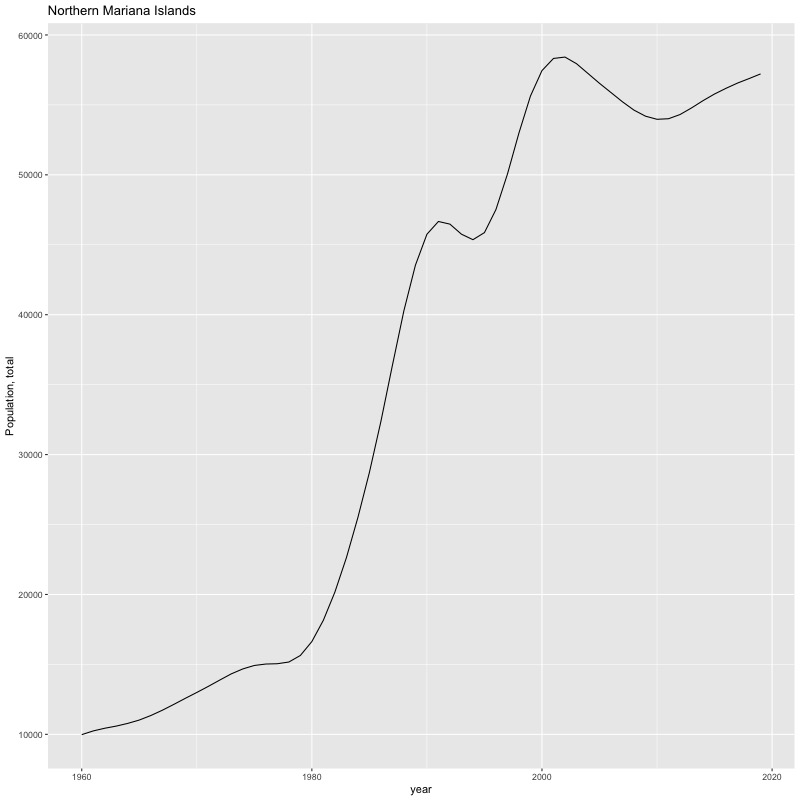
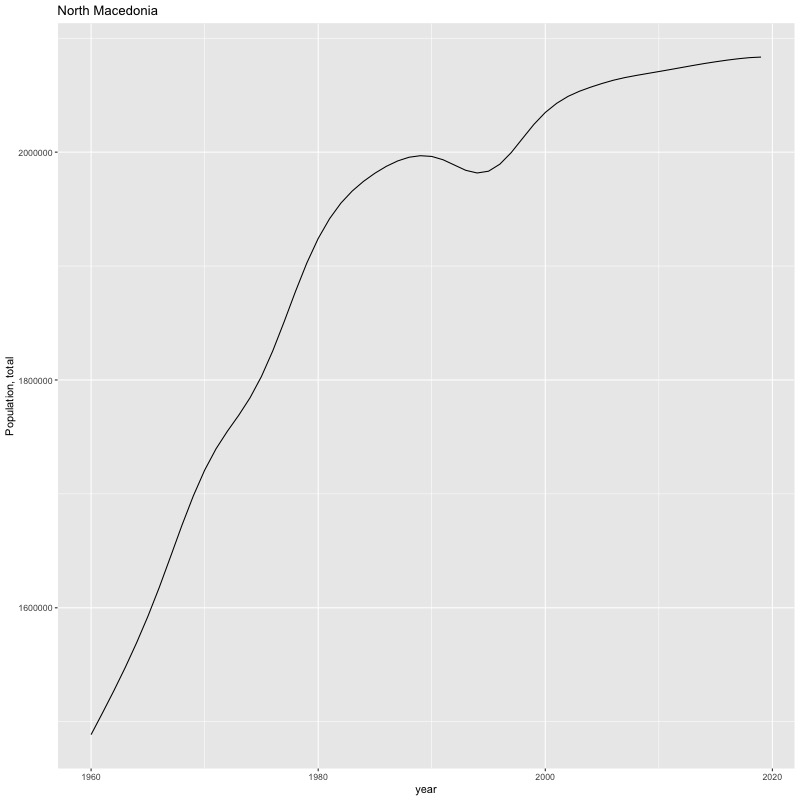
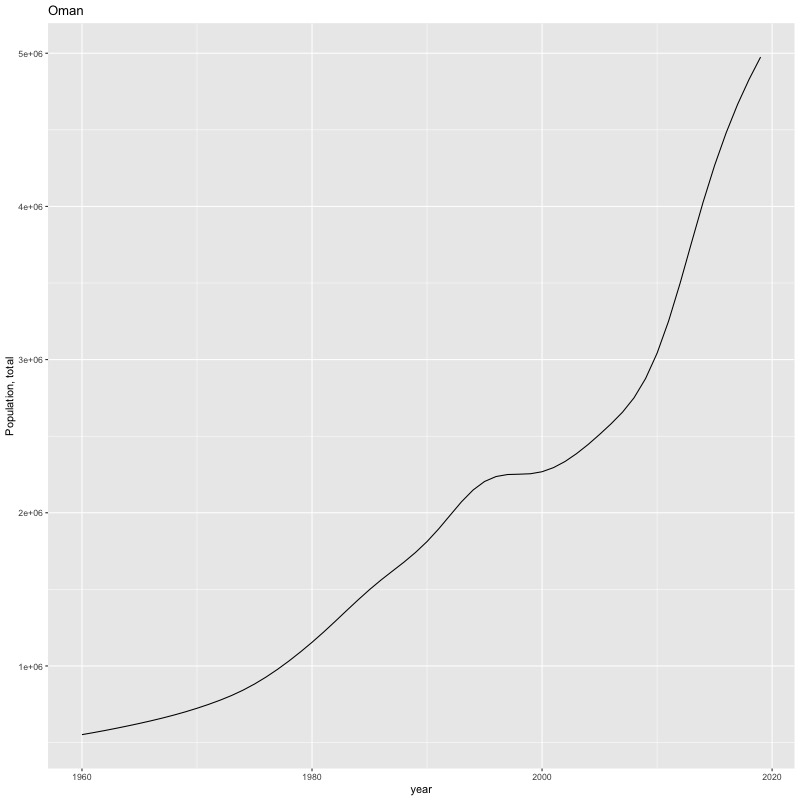
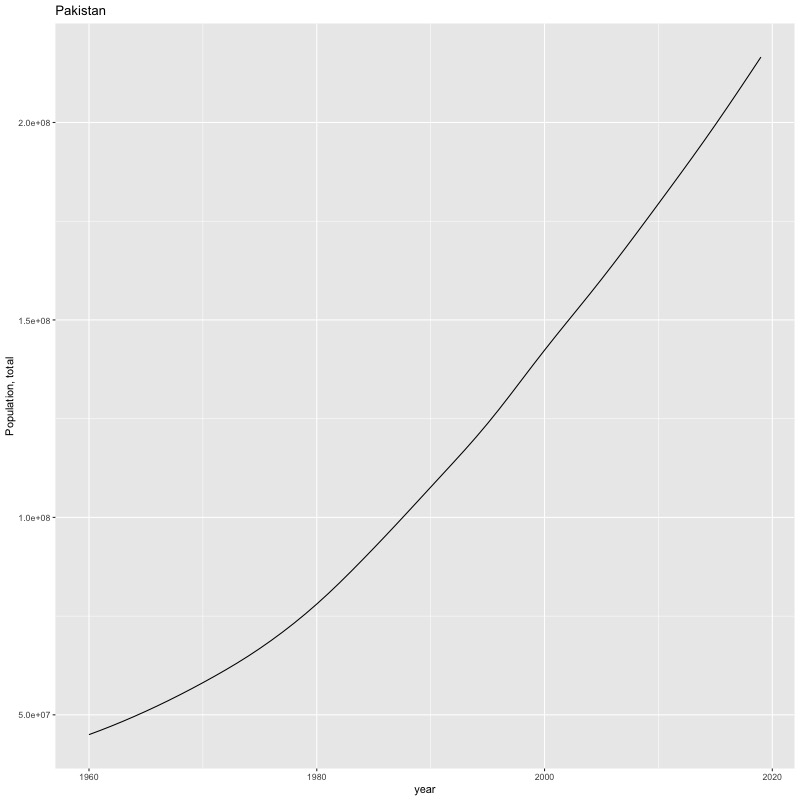
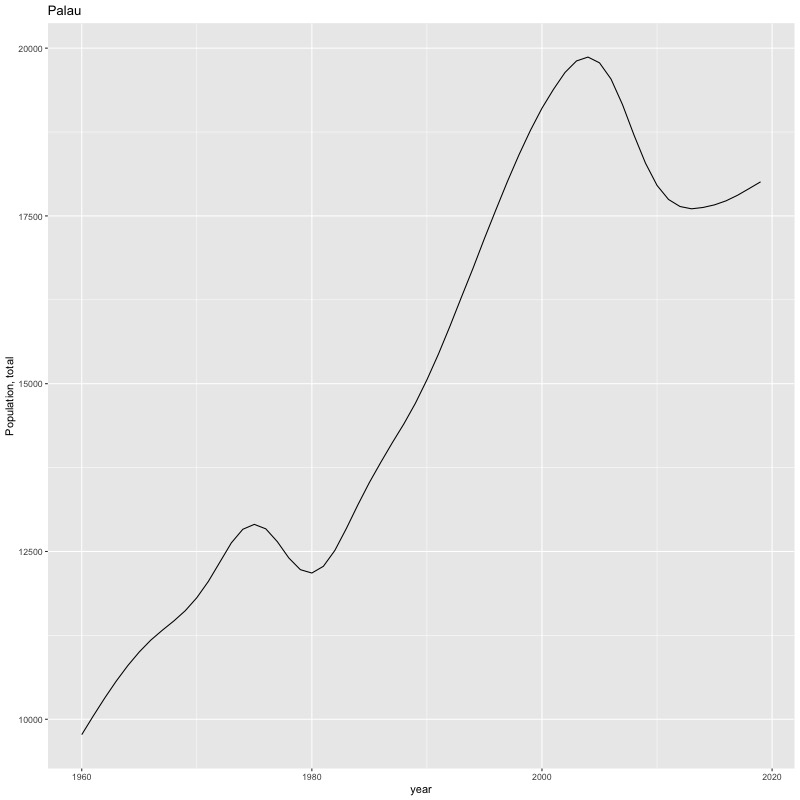
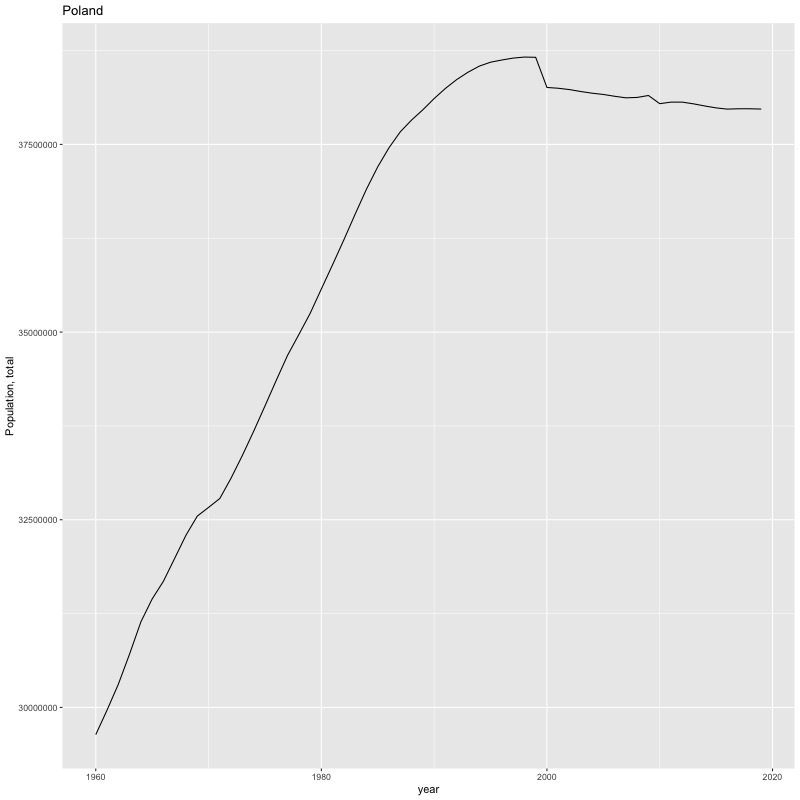
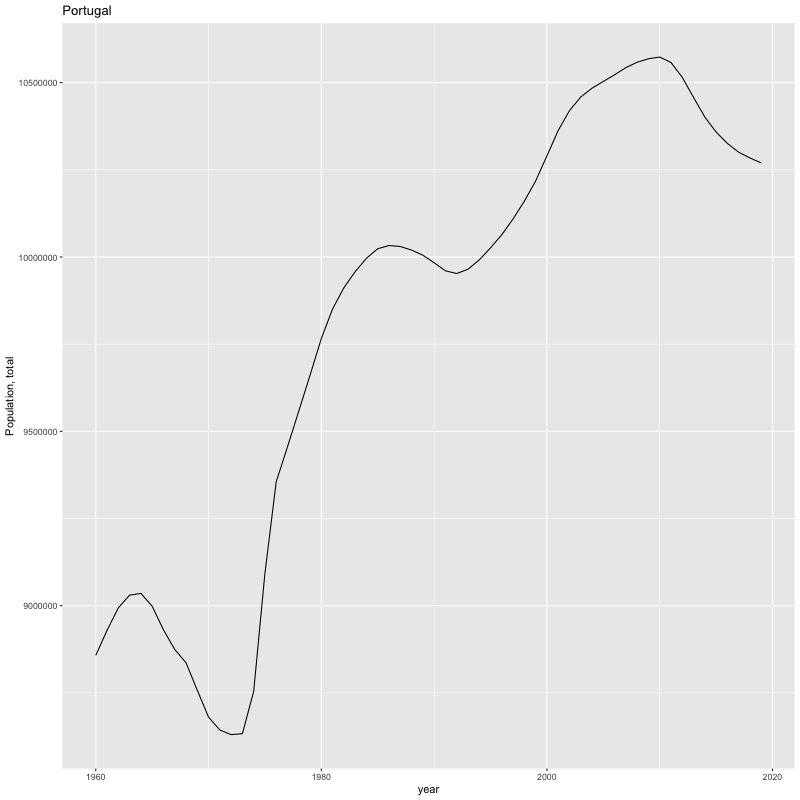
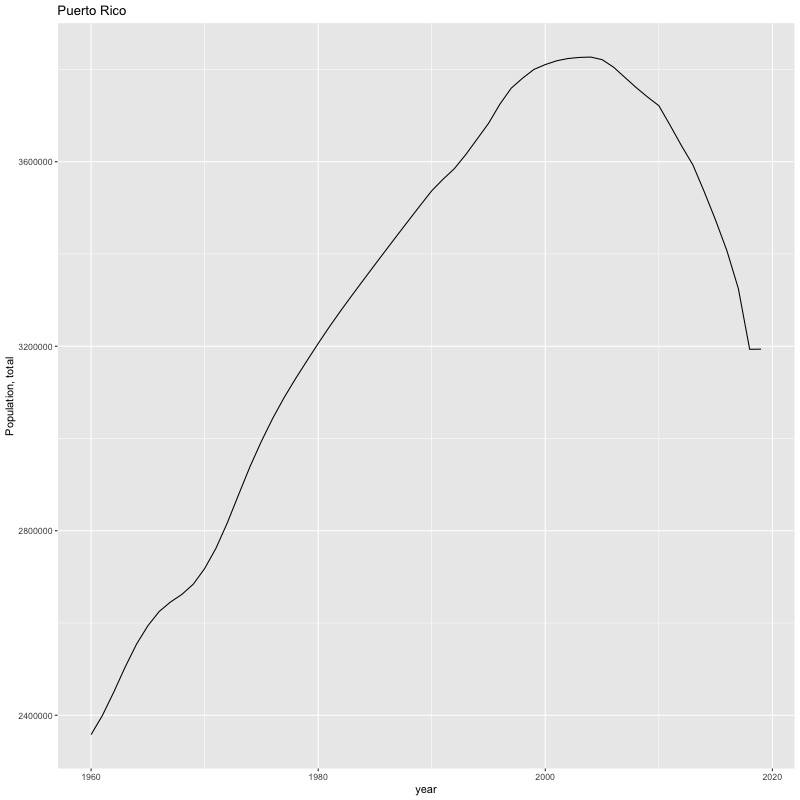
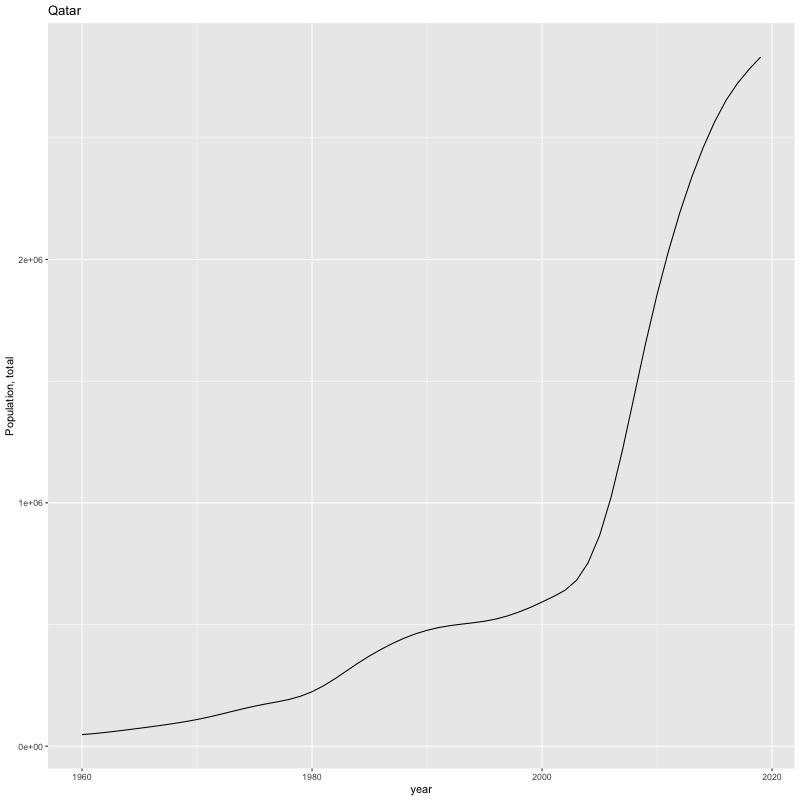
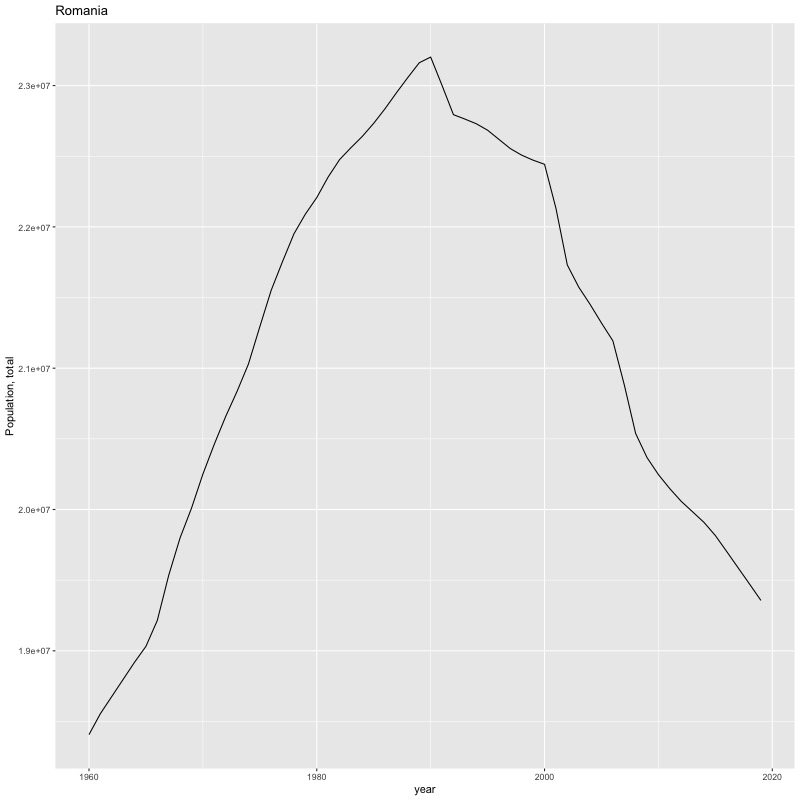
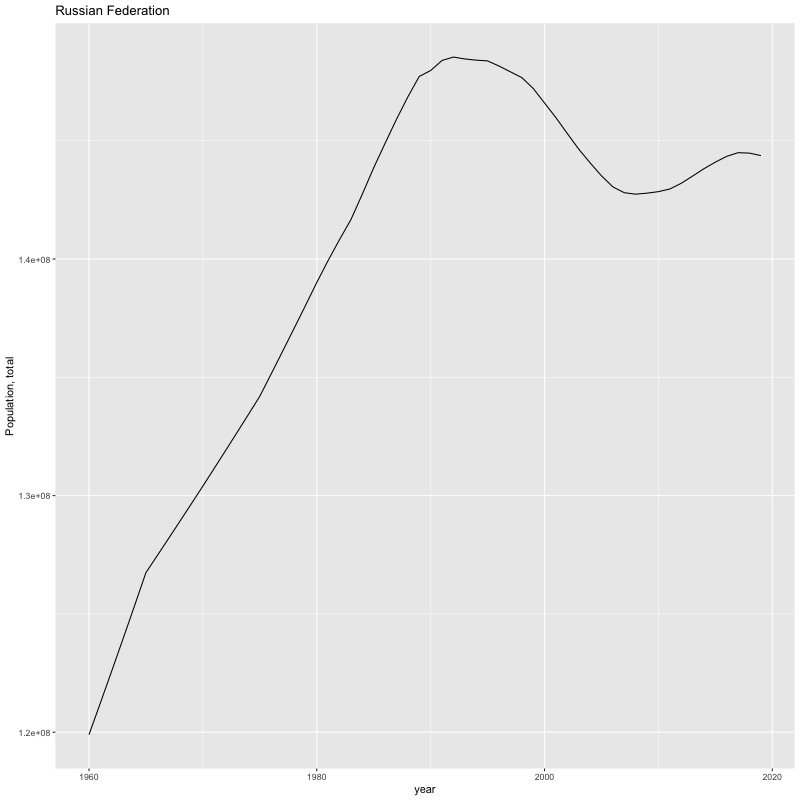
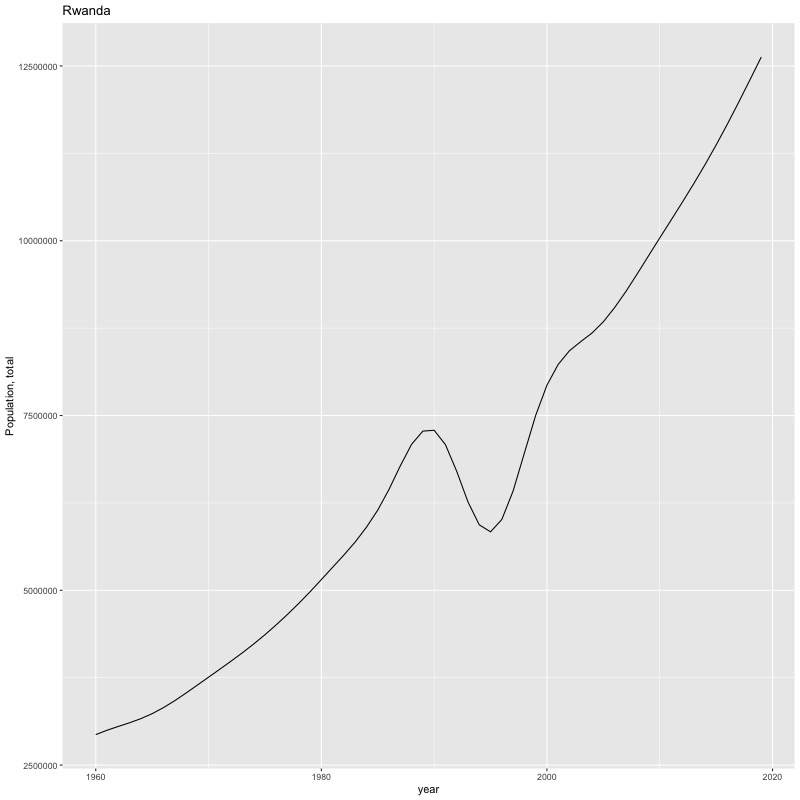
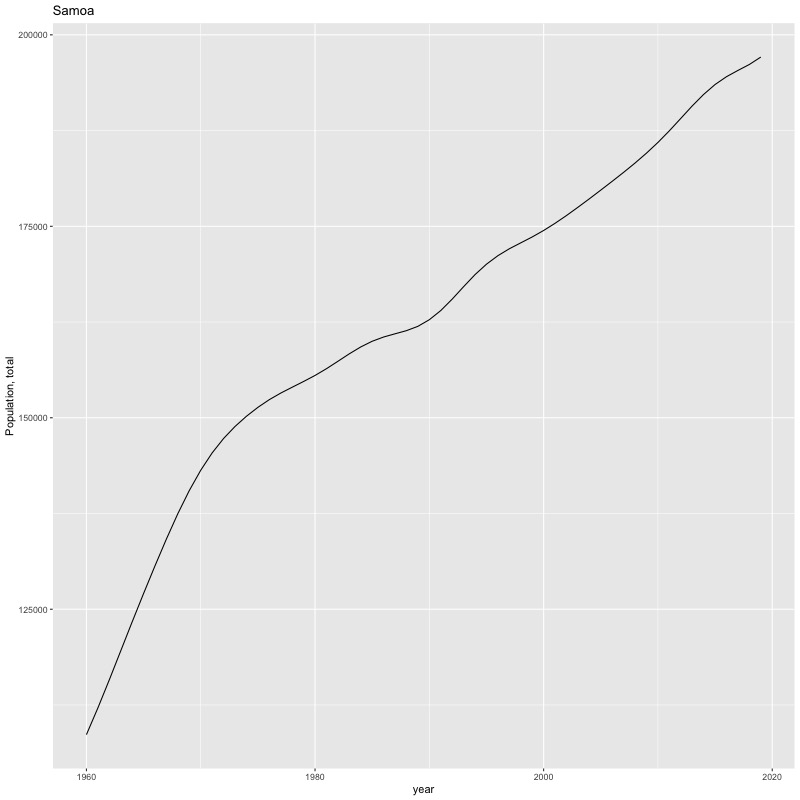
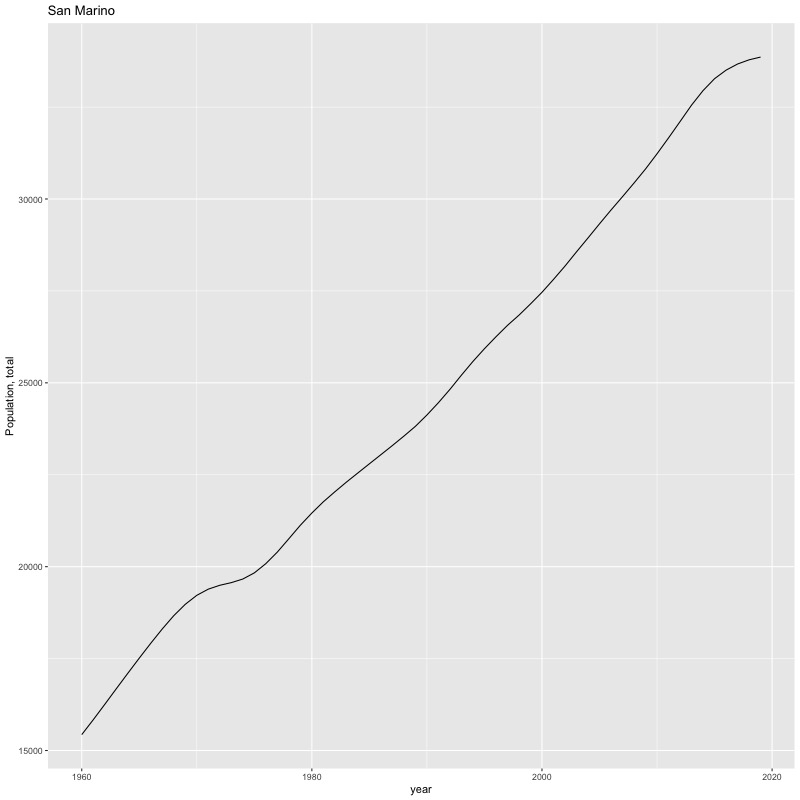
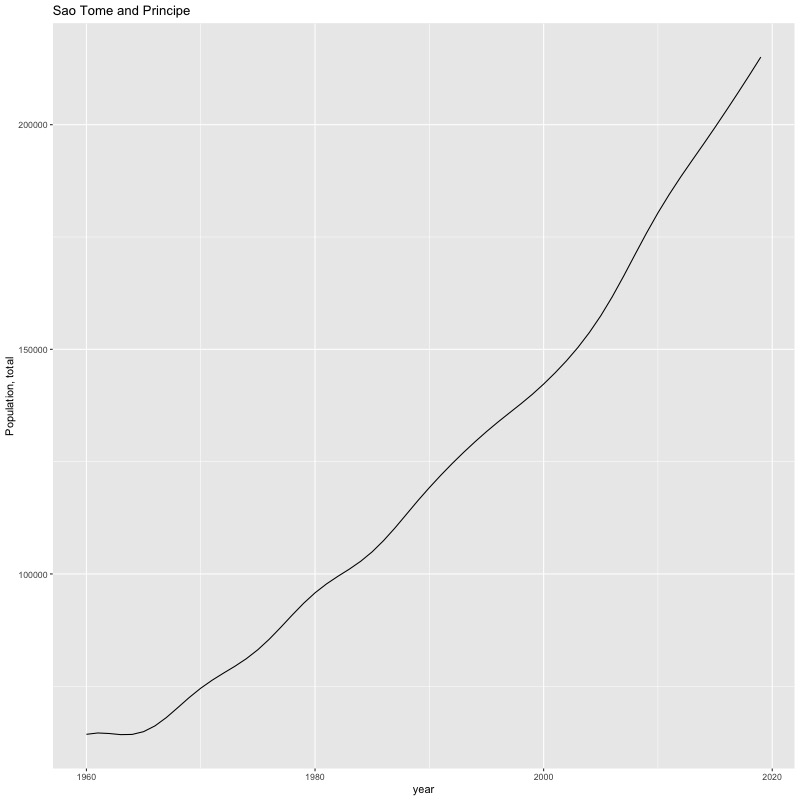
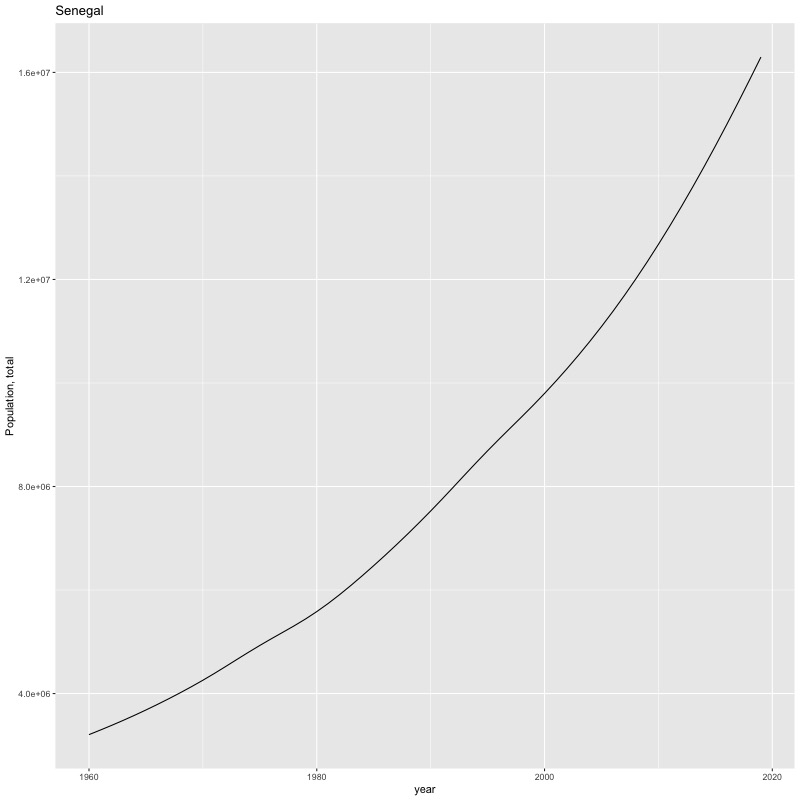
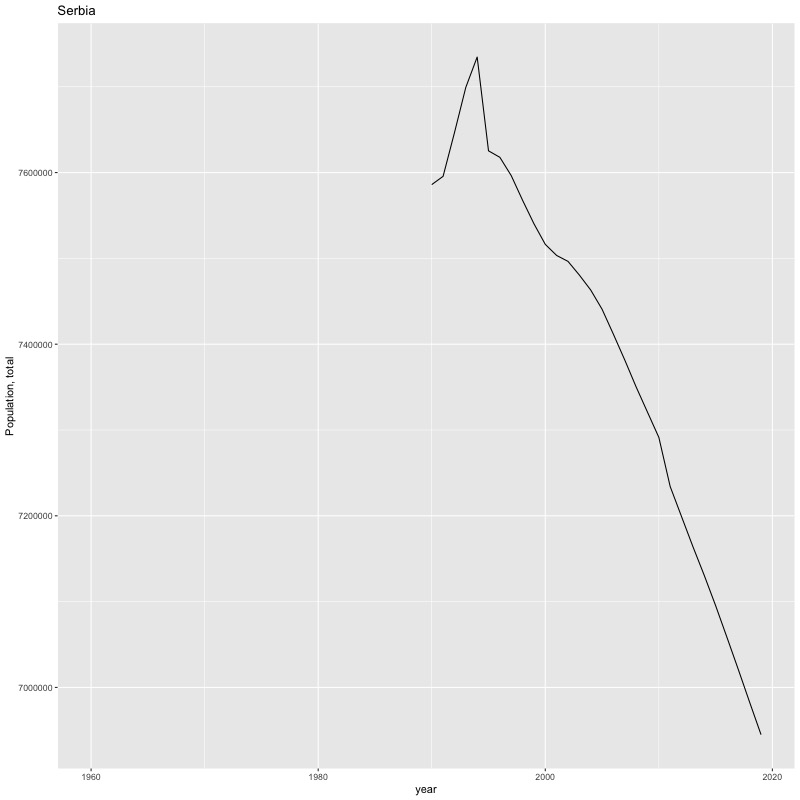
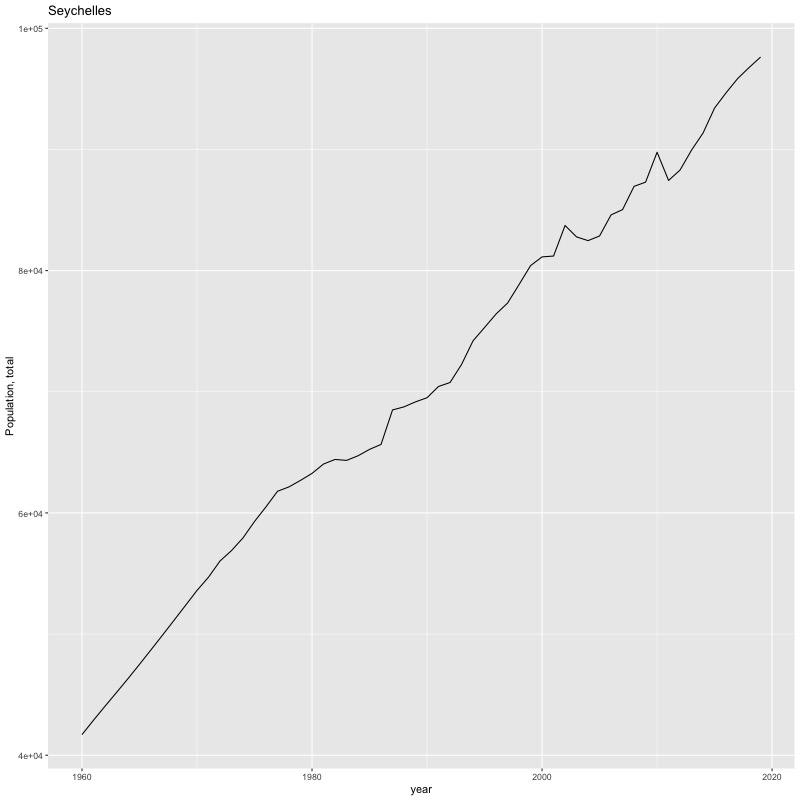
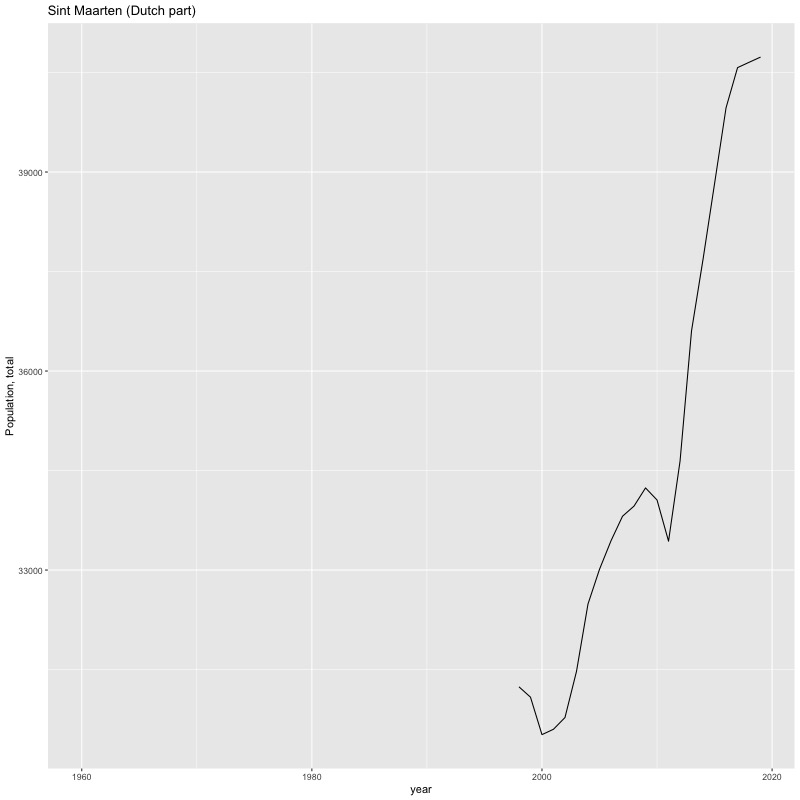
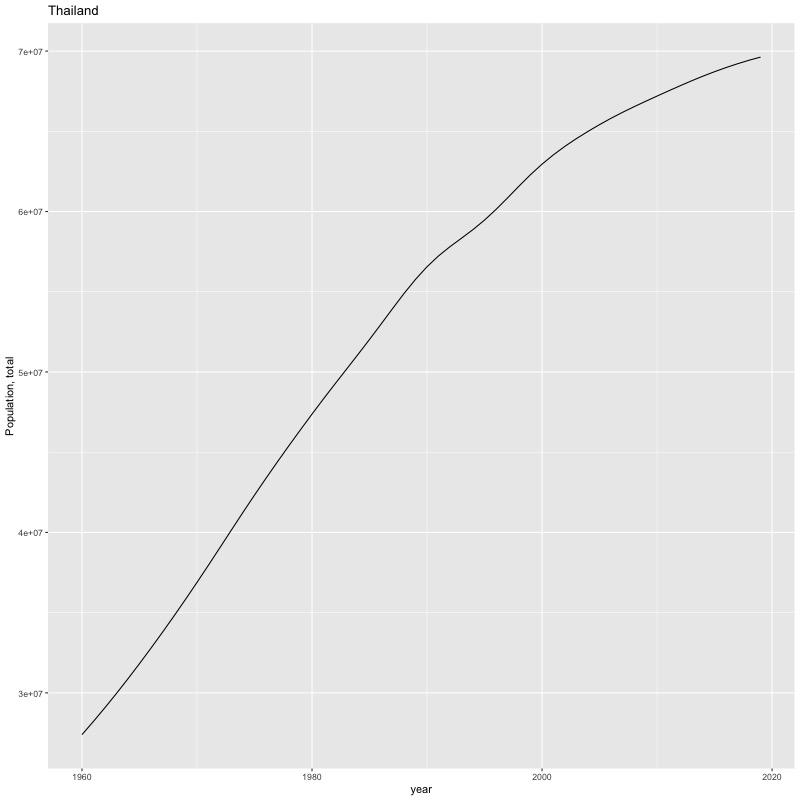
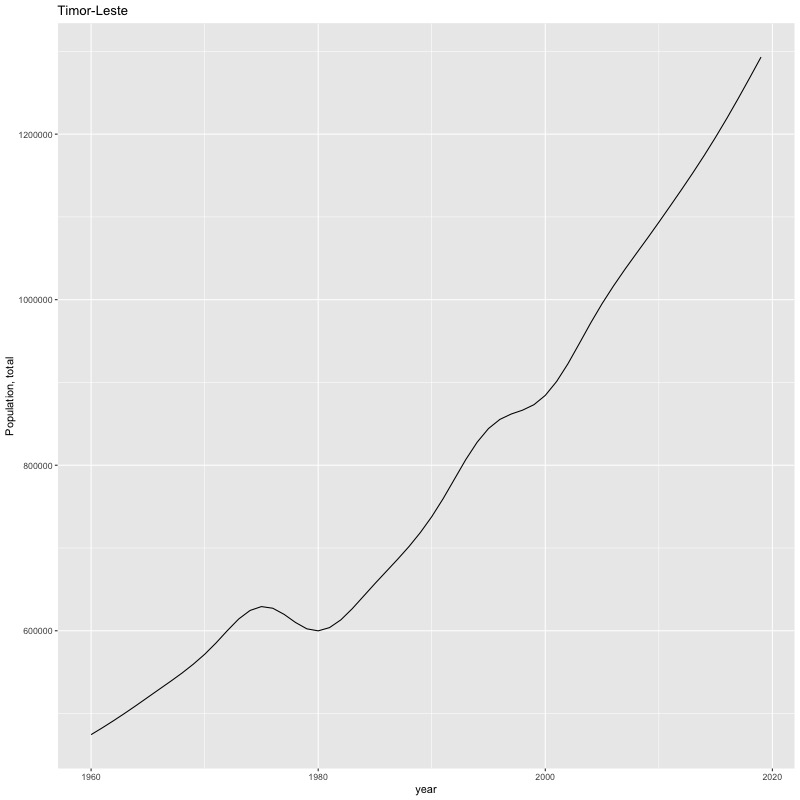
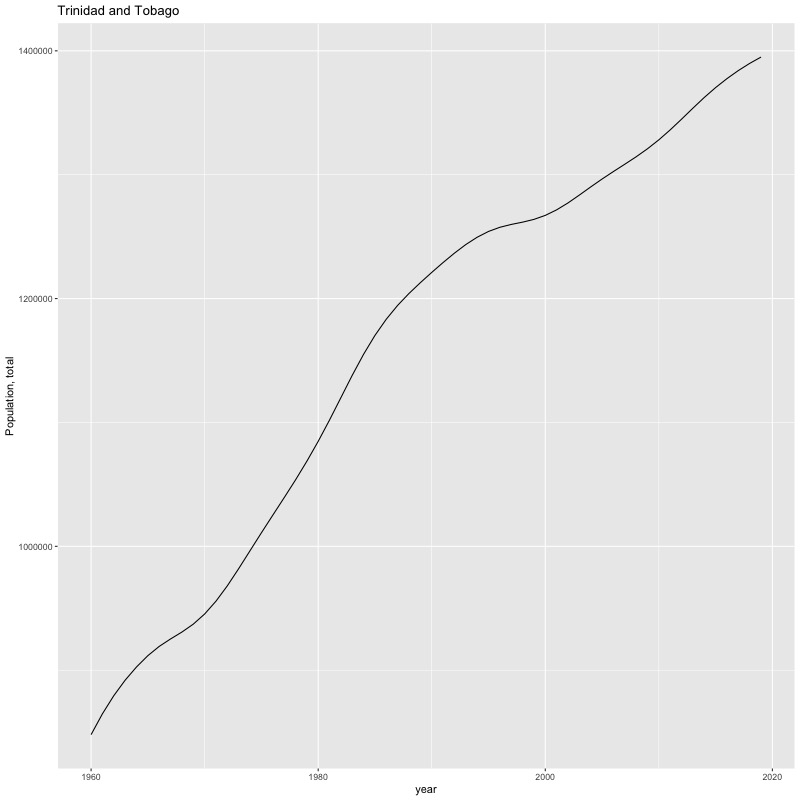
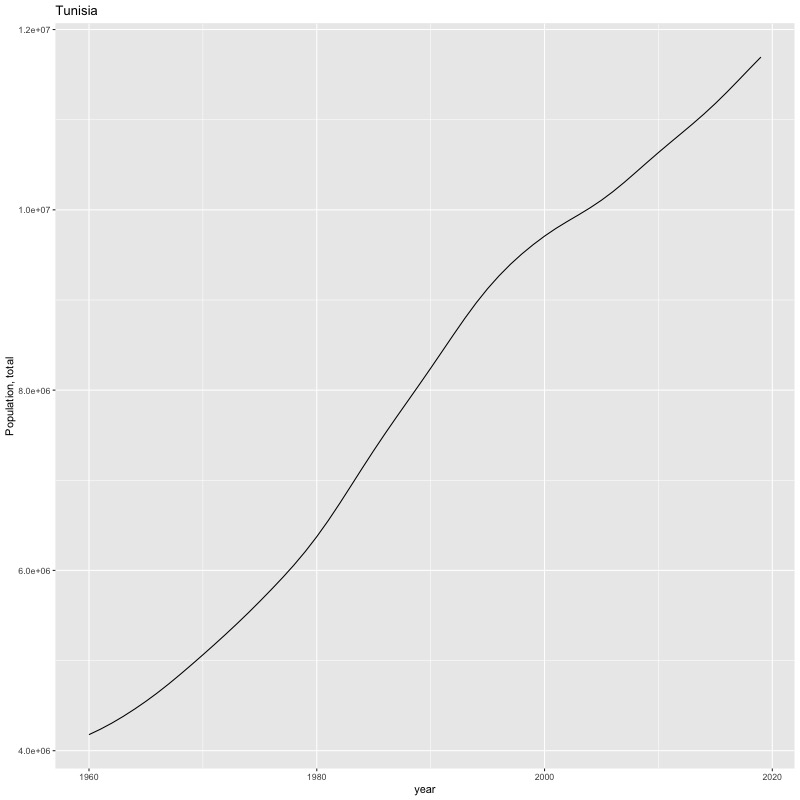
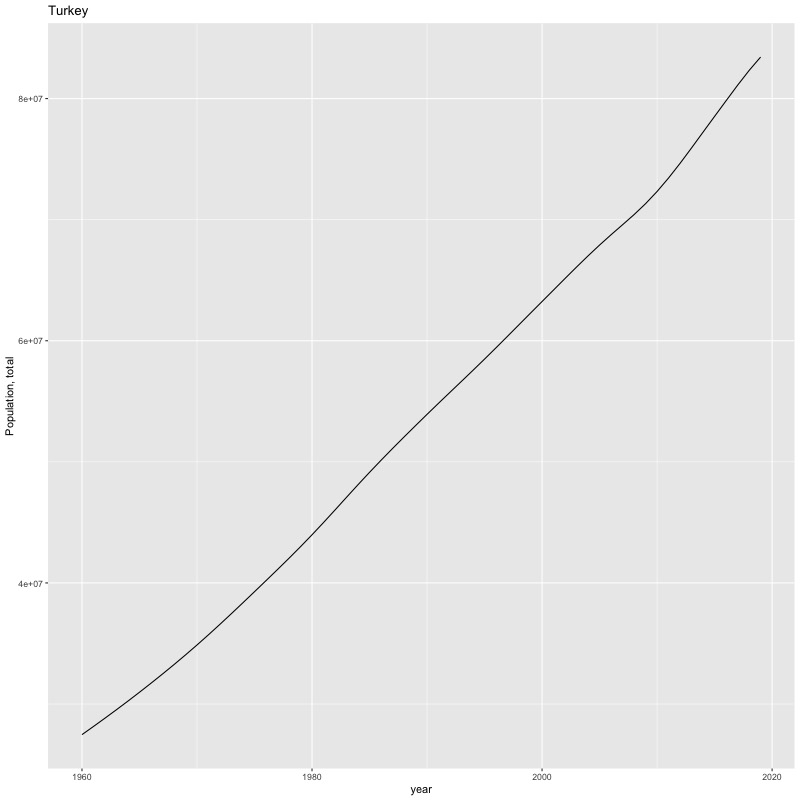
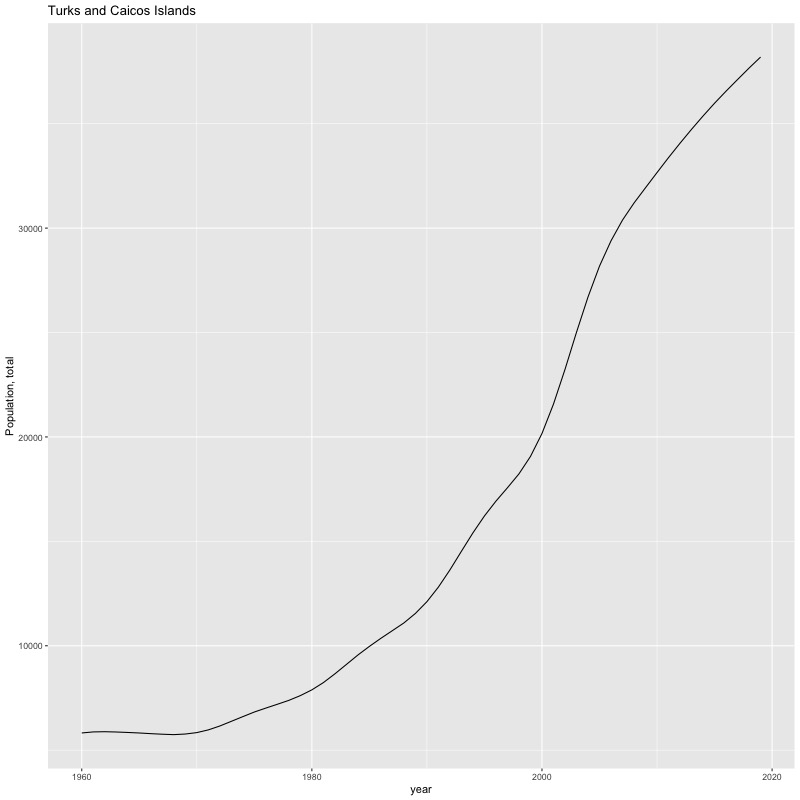
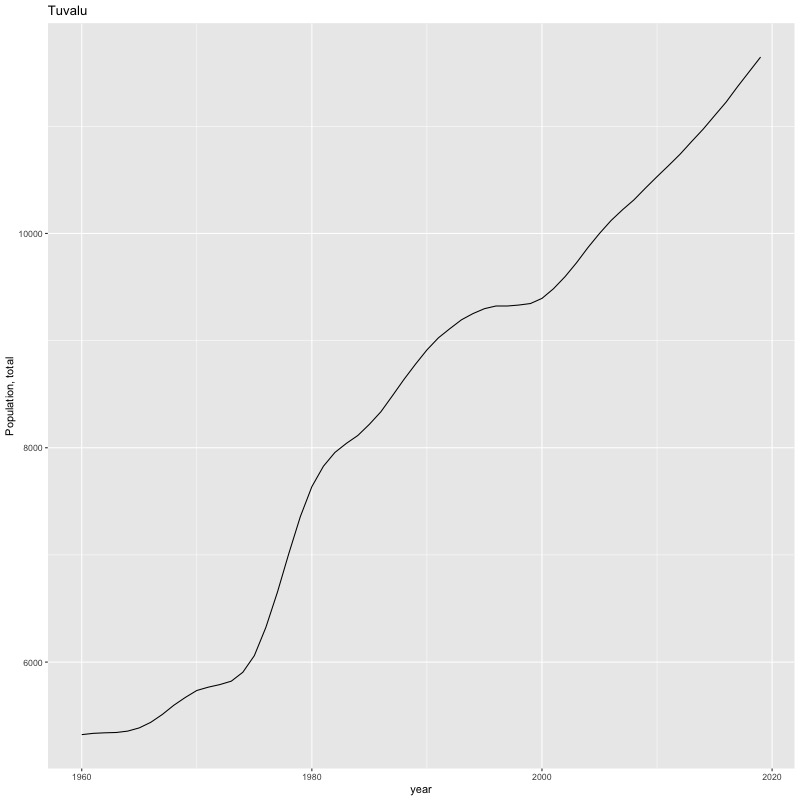
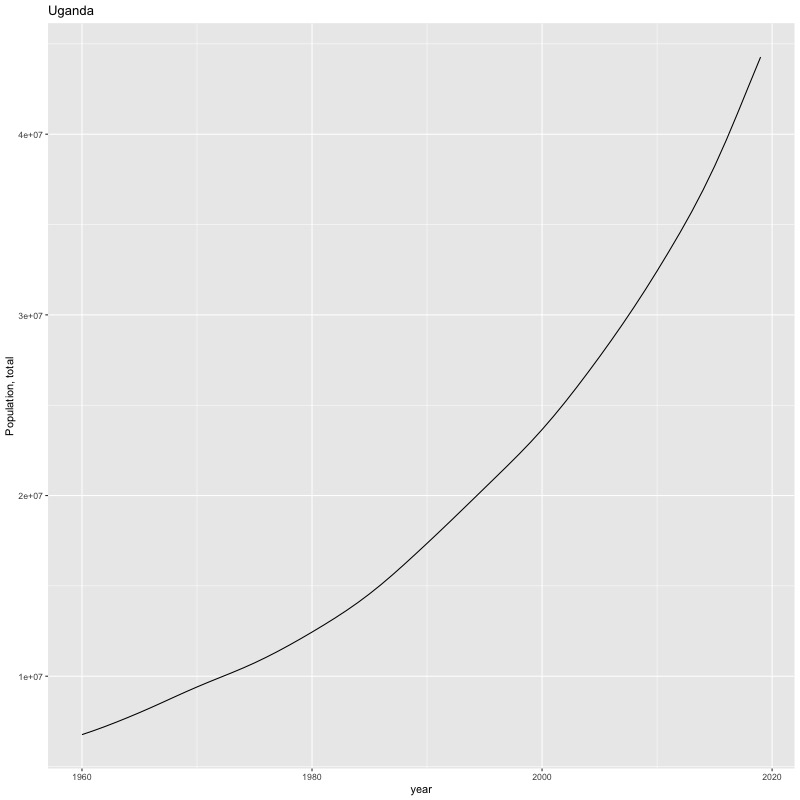
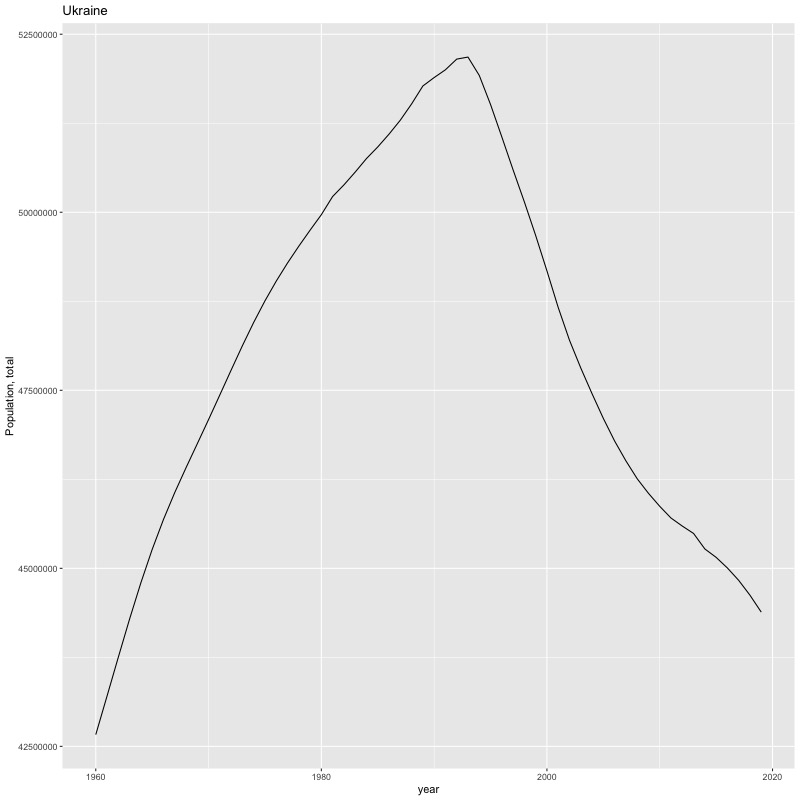
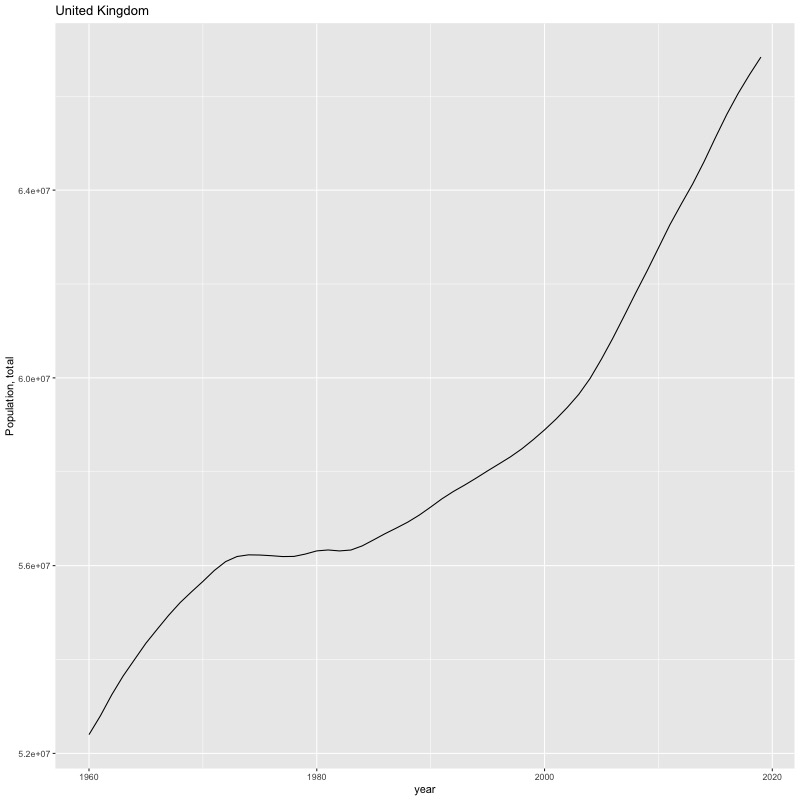
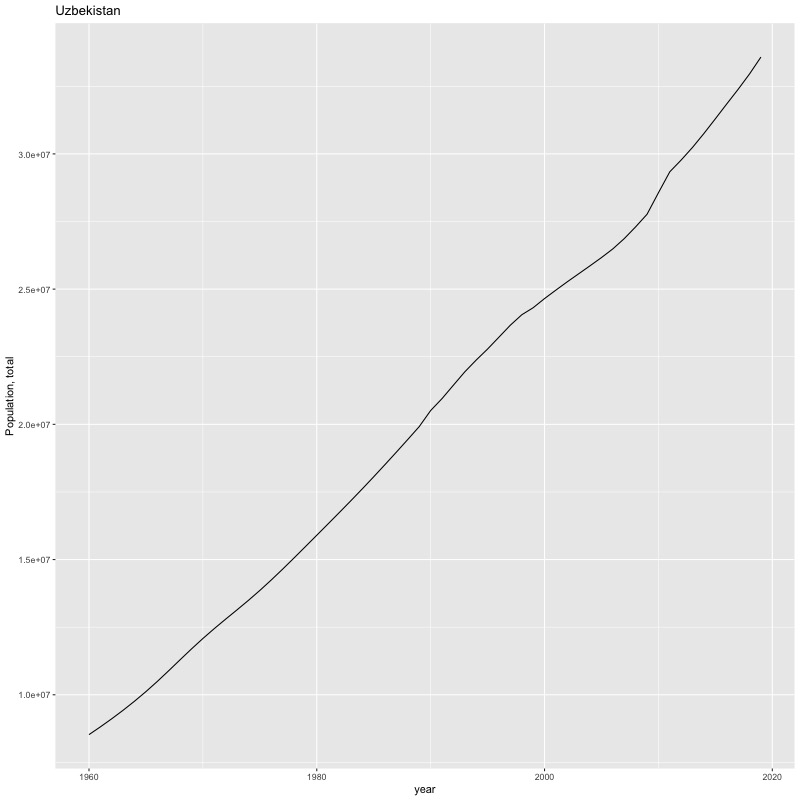
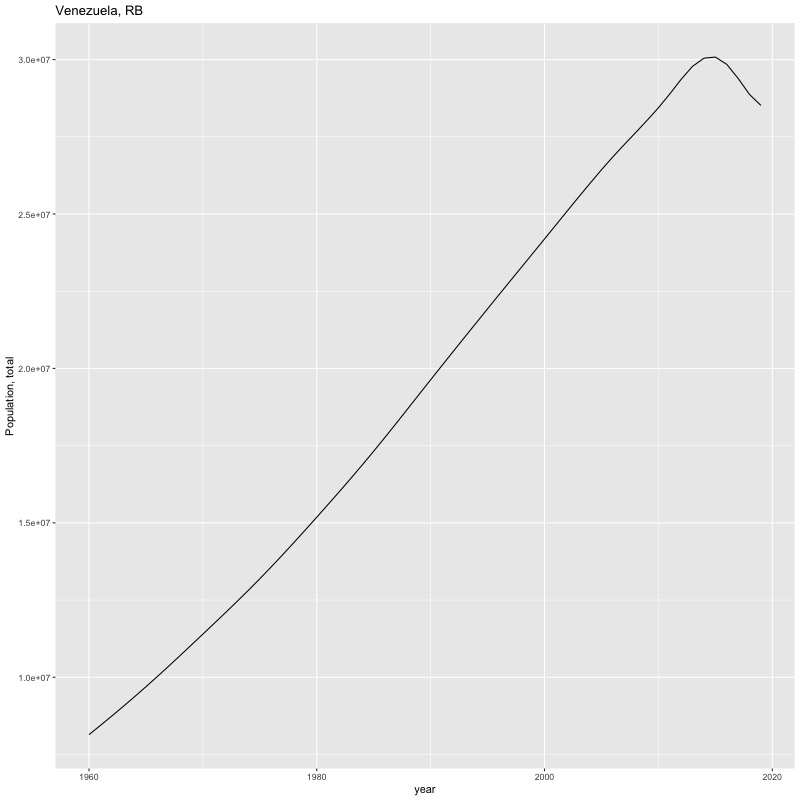
## [883] "Population, total"
## [884] "Portfolio equity, net inflows (BoP, current US$)"
## [885] "Portfolio investment, bonds (PPG + PNG) (NFL, current US$)"
## [886] "Portfolio investment, net (BoP, current US$)"
## [887] "Poverty headcount ratio at national poverty lines (% of population)"
## [888] "Power outages in firms in a typical month (number)"
## [889] "PPG, bonds (NFL, current US$)"
## [890] "PPG, commercial banks (NFL, current US$)"
## [891] "PPG, IBRD (DOD, current US$)"
## [892] "PPG, IDA (DOD, current US$)"
## [893] "PPG, official creditors (NFL, current US$)"
## [894] "PPG, other private creditors (NFL, current US$)"
## [895] "PPG, private creditors (NFL, current US$)"
## [896] "PPP conversion factor, GDP (LCU per international $)"
## [897] "PPP conversion factor, private consumption (LCU per international $)"
## [898] "Pregnant women receiving prenatal care (%)"
## [899] "Preprimary education, duration (years)"
## [900] "Presence of peace keepers (number of troops, police, and military observers in mandate)"
## [901] "Present value of external debt (% of exports of goods, services and primary income)"
## [902] "Present value of external debt (% of GNI)"
## [903] "Present value of external debt (current US$)"
## [904] "Prevalence of anemia among children (% of children under 5)"
## [905] "Prevalence of anemia among non-pregnant women (% of women ages 15-49)"
## [906] "Prevalence of anemia among pregnant women (%)"
## [907] "Prevalence of anemia among women of reproductive age (% of women ages 15-49)"
## [908] "Prevalence of HIV, female (% ages 15-24)"
## [909] "Prevalence of HIV, male (% ages 15-24)"
## [910] "Prevalence of HIV, total (% of population ages 15-49)"
## [911] "Prevalence of moderate or severe food insecurity in the population (%)"
## [912] "Prevalence of overweight, weight for height (% of children under 5)"
## [913] "Prevalence of overweight, weight for height, female (% of children under 5)"
## [914] "Prevalence of overweight, weight for height, male (% of children under 5)"
## [915] "Prevalence of severe food insecurity in the population (%)"
## [916] "Prevalence of severe wasting, weight for height (% of children under 5)"
## [917] "Prevalence of severe wasting, weight for height, female (% of children under 5)"
## [918] "Prevalence of severe wasting, weight for height, male (% of children under 5)"
## [919] "Prevalence of stunting, height for age (% of children under 5)"
## [920] "Prevalence of stunting, height for age, female (% of children under 5)"
## [921] "Prevalence of stunting, height for age, male (% of children under 5)"
## [922] "Prevalence of undernourishment (% of population)"
## [923] "Prevalence of underweight, weight for age (% of children under 5)"
## [924] "Prevalence of underweight, weight for age, female (% of children under 5)"
## [925] "Prevalence of underweight, weight for age, male (% of children under 5)"
## [926] "Prevalence of wasting, weight for height (% of children under 5)"
## [927] "Prevalence of wasting, weight for height, female (% of children under 5)"
## [928] "Prevalence of wasting, weight for height, male (% of children under 5)"
## [929] "Price level ratio of PPP conversion factor (GDP) to market exchange rate"
## [930] "Primary completion rate, female (% of relevant age group)"
## [931] "Primary completion rate, male (% of relevant age group)"
## [932] "Primary completion rate, total (% of relevant age group)"
## [933] "Primary education, duration (years)"
## [934] "Primary education, pupils"
## [935] "Primary education, pupils (% female)"
## [936] "Primary education, teachers"
## [937] "Primary education, teachers (% female)"
## [938] "Primary government expenditures as a proportion of original approved budget (%)"
## [939] "Primary income payments (BoP, current US$)"
## [940] "Primary income receipts (BoP, current US$)"
## [941] "Primary school starting age (years)"
## [942] "Private credit bureau coverage (% of adults)"
## [943] "Probability of dying at age 5-14 years (per 1,000 children age 5)"
## [944] "Procedures to build a warehouse (number)"
## [945] "Procedures to register property (number)"
## [946] "Profit tax (% of commercial profits)"
## [947] "Progression to secondary school (%)"
## [948] "Progression to secondary school, female (%)"
## [949] "Progression to secondary school, male (%)"
## [950] "Proportion of population pushed below the $1.90 ($ 2011 PPP) poverty line by out-of-pocket health care expenditure (%)"
## [951] "Proportion of population spending more than 10% of household consumption or income on out-of-pocket health care expenditure (%)"
## [952] "Proportion of population spending more than 25% of household consumption or income on out-of-pocket health care expenditure (%)"
## [953] "Proportion of seats held by women in national parliaments (%)"
## [954] "Proportion of women subjected to physical and/or sexual violence in the last 12 months (% of women age 15-49)"
## [955] "Public and publicly guaranteed debt service (% of exports of goods, services and primary income)"
## [956] "Public and publicly guaranteed debt service (% of GNI)"
## [957] "Public credit registry coverage (% of adults)"
## [958] "Public private partnerships investment in energy (current US$)"
## [959] "Pump price for diesel fuel (US$ per liter)"
## [960] "Pump price for gasoline (US$ per liter)"
## [961] "Pupil-teacher ratio, lower secondary"
## [962] "Pupil-teacher ratio, preprimary"
## [963] "Pupil-teacher ratio, primary"
## [964] "Pupil-teacher ratio, secondary"
## [965] "Pupil-teacher ratio, tertiary"
## [966] "Pupil-teacher ratio, upper secondary"
## [967] "Ratio of female to male labor force participation rate (%) (modeled ILO estimate)"
## [968] "Ratio of female to male labor force participation rate (%) (national estimate)"
## [969] "Real interest rate (%)"
## [970] "Refugee population by country or territory of asylum"
## [971] "Refugee population by country or territory of origin"
## [972] "Renewable electricity output (% of total electricity output)"
## [973] "Renewable energy consumption (% of total final energy consumption)"
## [974] "Renewable internal freshwater resources per capita (cubic meters)"
## [975] "Renewable internal freshwater resources, total (billion cubic meters)"
## [976] "Repeaters, primary, female (% of female enrollment)"
## [977] "Repeaters, primary, male (% of male enrollment)"
## [978] "Repeaters, primary, total (% of total enrollment)"
## [979] "Reserves and related items (BoP, current US$)"
## [980] "Revenue, excluding grants (% of GDP)"
## [981] "Revenue, excluding grants (current LCU)"
## [982] "Rural population"
## [983] "Rural population (% of total population)"
## [984] "Rural population growth (annual %)"
## [985] "School enrollment, preprimary (% gross)"
## [986] "School enrollment, preprimary, female (% gross)"
## [987] "School enrollment, preprimary, male (% gross)"
## [988] "School enrollment, primary (% gross)"
## [989] "School enrollment, primary (% net)"
## [990] "School enrollment, primary (gross), gender parity index (GPI)"
## [991] "School enrollment, primary and secondary (gross), gender parity index (GPI)"
## [992] "School enrollment, primary, female (% gross)"
## [993] "School enrollment, primary, female (% net)"
## [994] "School enrollment, primary, male (% gross)"
## [995] "School enrollment, primary, male (% net)"
## [996] "School enrollment, primary, private (% of total primary)"
## [997] "School enrollment, secondary (% gross)"
## [998] "School enrollment, secondary (% net)"
## [999] "School enrollment, secondary (gross), gender parity index (GPI)"
## [1000] "School enrollment, secondary, female (% gross)"
## [1001] "School enrollment, secondary, female (% net)"
## [1002] "School enrollment, secondary, male (% gross)"
## [1003] "School enrollment, secondary, male (% net)"
## [1004] "School enrollment, secondary, private (% of total secondary)"
## [1005] "School enrollment, tertiary (% gross)"
## [1006] "School enrollment, tertiary (gross), gender parity index (GPI)"
## [1007] "School enrollment, tertiary, female (% gross)"
## [1008] "School enrollment, tertiary, male (% gross)"
## [1009] "Scientific and technical journal articles"
## [1010] "Secondary education, duration (years)"
## [1011] "Secondary education, general pupils"
## [1012] "Secondary education, general pupils (% female)"
## [1013] "Secondary education, pupils"
## [1014] "Secondary education, pupils (% female)"
## [1015] "Secondary education, teachers"
## [1016] "Secondary education, teachers (% female)"
## [1017] "Secondary education, teachers, female"
## [1018] "Secondary education, vocational pupils"
## [1019] "Secondary education, vocational pupils (% female)"
## [1020] "Secondary income receipts (BoP, current US$)"
## [1021] "Secondary income, other sectors, payments (BoP, current US$)"
## [1022] "Secure Internet servers"
## [1023] "Secure Internet servers (per 1 million people)"
## [1024] "Self-employed, female (% of female employment) (modeled ILO estimate)"
## [1025] "Self-employed, male (% of male employment) (modeled ILO estimate)"
## [1026] "Self-employed, total (% of total employment) (modeled ILO estimate)"
## [1027] "Service exports (BoP, current US$)"
## [1028] "Service imports (BoP, current US$)"
## [1029] "Services, value added (% of GDP)"
## [1030] "Services, value added (annual % growth)"
## [1031] "Services, value added (constant 2010 US$)"
## [1032] "Services, value added (constant LCU)"
## [1033] "Services, value added (current LCU)"
## [1034] "Services, value added (current US$)"
## [1035] "Services, value added per worker (constant 2010 US$)"
## [1036] "Sex ratio at birth (male births per female births)"
## [1037] "Share of tariff lines with international peaks, all products (%)"
## [1038] "Share of tariff lines with international peaks, manufactured products (%)"
## [1039] "Share of tariff lines with international peaks, primary products (%)"
## [1040] "Share of tariff lines with specific rates, all products (%)"
## [1041] "Share of tariff lines with specific rates, manufactured products (%)"
## [1042] "Share of tariff lines with specific rates, primary products (%)"
## [1043] "Share of youth not in education, employment or training, female (% of female youth population)"
## [1044] "Share of youth not in education, employment or training, male (% of male youth population)"
## [1045] "Share of youth not in education, employment or training, total (% of youth population)"
## [1046] "Short-term debt (% of exports of goods, services and primary income)"
## [1047] "Short-term debt (% of total external debt)"
## [1048] "Short-term debt (% of total reserves)"
## [1049] "Social contributions (% of revenue)"
## [1050] "Social contributions (current LCU)"
## [1051] "Source data assessment of statistical capacity (scale 0 - 100)"
## [1052] "Specialist surgical workforce (per 100,000 population)"
## [1053] "Start-up procedures to register a business (number)"
## [1054] "Start-up procedures to register a business, female (number)"
## [1055] "Start-up procedures to register a business, male (number)"
## [1056] "Statistical Capacity score (Overall average)"
## [1057] "Strength of legal rights index (0=weak to 12=strong)"
## [1058] "Subsidies and other transfers (% of expense)"
## [1059] "Subsidies and other transfers (current LCU)"
## [1060] "Suicide mortality rate (per 100,000 population)"
## [1061] "Suicide mortality rate, female (per 100,000 female population)"
## [1062] "Suicide mortality rate, male (per 100,000 male population)"
## [1063] "Surface area (sq. km)"
## [1064] "Survival to age 65, female (% of cohort)"
## [1065] "Survival to age 65, male (% of cohort)"
## [1066] "Tariff rate, applied, simple mean, all products (%)"
## [1067] "Tariff rate, applied, simple mean, manufactured products (%)"
## [1068] "Tariff rate, applied, simple mean, primary products (%)"
## [1069] "Tariff rate, applied, weighted mean, all products (%)"
## [1070] "Tariff rate, applied, weighted mean, manufactured products (%)"
## [1071] "Tariff rate, applied, weighted mean, primary products (%)"
## [1072] "Tariff rate, most favored nation, simple mean, all products (%)"
## [1073] "Tariff rate, most favored nation, simple mean, manufactured products (%)"
## [1074] "Tariff rate, most favored nation, simple mean, primary products (%)"
## [1075] "Tariff rate, most favored nation, weighted mean, all products (%)"
## [1076] "Tariff rate, most favored nation, weighted mean, manufactured products (%)"
## [1077] "Tariff rate, most favored nation, weighted mean, primary products (%)"
## [1078] "Tax payments (number)"
## [1079] "Tax revenue (% of GDP)"
## [1080] "Tax revenue (current LCU)"
## [1081] "Taxes less subsidies on products (constant LCU)"
## [1082] "Taxes less subsidies on products (current LCU)"
## [1083] "Taxes less subsidies on products (current US$)"
## [1084] "Taxes on exports (% of tax revenue)"
## [1085] "Taxes on exports (current LCU)"
## [1086] "Taxes on goods and services (% of revenue)"
## [1087] "Taxes on goods and services (% value added of industry and services)"
## [1088] "Taxes on goods and services (current LCU)"
## [1089] "Taxes on income, profits and capital gains (% of revenue)"
## [1090] "Taxes on income, profits and capital gains (% of total taxes)"
## [1091] "Taxes on income, profits and capital gains (current LCU)"
## [1092] "Taxes on international trade (% of revenue)"
## [1093] "Taxes on international trade (current LCU)"
## [1094] "Technical cooperation grants (BoP, current US$)"
## [1095] "Teenage mothers (% of women ages 15-19 who have had children or are currently pregnant)"
## [1096] "Terrestrial and marine protected areas (% of total territorial area)"
## [1097] "Terrestrial protected areas (% of total land area)"
## [1098] "Tertiary education, academic staff (% female)"
## [1099] "Time required to build a warehouse (days)"
## [1100] "Time required to enforce a contract (days)"
## [1101] "Time required to get electricity (days)"
## [1102] "Time required to obtain an operating license (days)"
## [1103] "Time required to register property (days)"
## [1104] "Time required to start a business (days)"
## [1105] "Time required to start a business, female (days)"
## [1106] "Time required to start a business, male (days)"
## [1107] "Time spent dealing with the requirements of government regulations (% of senior management time)"
## [1108] "Time to export, border compliance (hours)"
## [1109] "Time to export, documentary compliance (hours)"
## [1110] "Time to import, border compliance (hours)"
## [1111] "Time to import, documentary compliance (hours)"
## [1112] "Time to obtain an electrical connection (days)"
## [1113] "Time to prepare and pay taxes (hours)"
## [1114] "Time to resolve insolvency (years)"
## [1115] "Total alcohol consumption per capita (liters of pure alcohol, projected estimates, 15+ years of age)"
## [1116] "Total alcohol consumption per capita, female (liters of pure alcohol, projected estimates, female 15+ years of age)"
## [1117] "Total alcohol consumption per capita, male (liters of pure alcohol, projected estimates, male 15+ years of age)"
## [1118] "Total debt service (% of exports of goods, services and primary income)"
## [1119] "Total debt service (% of GNI)"
## [1120] "Total fisheries production (metric tons)"
## [1121] "Total greenhouse gas emissions (% change from 1990)"
## [1122] "Total greenhouse gas emissions (kt of CO2 equivalent)"
## [1123] "Total natural resources rents (% of GDP)"
## [1124] "Total reserves (% of total external debt)"
## [1125] "Total reserves (includes gold, current US$)"
## [1126] "Total reserves in months of imports"
## [1127] "Total reserves minus gold (current US$)"
## [1128] "Total tax and contribution rate (% of profit)"
## [1129] "Trade (% of GDP)"
## [1130] "Trade in services (% of GDP)"
## [1131] "Transport services (% of commercial service exports)"
## [1132] "Transport services (% of commercial service imports)"
## [1133] "Transport services (% of service exports, BoP)"
## [1134] "Transport services (% of service imports, BoP)"
## [1135] "Travel services (% of commercial service exports)"
## [1136] "Travel services (% of commercial service imports)"
## [1137] "Travel services (% of service exports, BoP)"
## [1138] "Travel services (% of service imports, BoP)"
## [1139] "Tuberculosis case detection rate (%, all forms)"
## [1140] "Tuberculosis treatment success rate (% of new cases)"
## [1141] "UHC service coverage index"
## [1142] "Unemployment with advanced education (% of total labor force with advanced education)"
## [1143] "Unemployment with advanced education, female (% of female labor force with advanced education)"
## [1144] "Unemployment with advanced education, male (% of male labor force with advanced education)"
## [1145] "Unemployment with basic education (% of total labor force with basic education)"
## [1146] "Unemployment with basic education, female (% of female labor force with basic education)"
## [1147] "Unemployment with basic education, male (% of male labor force with basic education)"
## [1148] "Unemployment with intermediate education (% of total labor force with intermediate education)"
## [1149] "Unemployment with intermediate education, female (% of female labor force with intermediate education)"
## [1150] "Unemployment with intermediate education, male (% of male labor force with intermediate education)"
## [1151] "Unemployment, female (% of female labor force) (modeled ILO estimate)"
## [1152] "Unemployment, female (% of female labor force) (national estimate)"
## [1153] "Unemployment, male (% of male labor force) (modeled ILO estimate)"
## [1154] "Unemployment, male (% of male labor force) (national estimate)"
## [1155] "Unemployment, total (% of total labor force) (modeled ILO estimate)"
## [1156] "Unemployment, total (% of total labor force) (national estimate)"
## [1157] "Unemployment, youth female (% of female labor force ages 15-24) (modeled ILO estimate)"
## [1158] "Unemployment, youth female (% of female labor force ages 15-24) (national estimate)"
## [1159] "Unemployment, youth male (% of male labor force ages 15-24) (modeled ILO estimate)"
## [1160] "Unemployment, youth male (% of male labor force ages 15-24) (national estimate)"
## [1161] "Unemployment, youth total (% of total labor force ages 15-24) (modeled ILO estimate)"
## [1162] "Unemployment, youth total (% of total labor force ages 15-24) (national estimate)"
## [1163] "Unmet need for contraception (% of married women ages 15-49)"
## [1164] "Urban population"
## [1165] "Urban population (% of total population)"
## [1166] "Urban population growth (annual %)"
## [1167] "Use of IMF credit (DOD, current US$)"
## [1168] "Use of insecticide-treated bed nets (% of under-5 population)"
## [1169] "Value lost due to electrical outages (% of sales for affected firms)"
## [1170] "Vitamin A supplementation coverage rate (% of children ages 6-59 months)"
## [1171] "Vulnerable employment, female (% of female employment) (modeled ILO estimate)"
## [1172] "Vulnerable employment, male (% of male employment) (modeled ILO estimate)"
## [1173] "Vulnerable employment, total (% of total employment) (modeled ILO estimate)"
## [1174] "Wage and salaried workers, female (% of female employment) (modeled ILO estimate)"
## [1175] "Wage and salaried workers, male (% of male employment) (modeled ILO estimate)"
## [1176] "Wage and salaried workers, total (% of total employment) (modeled ILO estimate)"
## [1177] "Wanted fertility rate (births per woman)"
## [1178] "Women Business and the Law Index Score (scale 1-100)"
## [1179] "Women participating in the three decisions (own health care, major household purchases, and visiting family) (% of women age 15-49)"
## [1180] "Women who believe a husband is justified in beating his wife (any of five reasons) (%)"
## [1181] "Women who believe a husband is justified in beating his wife when she argues with him (%)"
## [1182] "Women who believe a husband is justified in beating his wife when she burns the food (%)"
## [1183] "Women who believe a husband is justified in beating his wife when she goes out without telling him (%)"
## [1184] "Women who believe a husband is justified in beating his wife when she neglects the children (%)"
## [1185] "Women who believe a husband is justified in beating his wife when she refuses sex with him (%)"
## [1186] "Women who were first married by age 15 (% of women ages 20-24)"
## [1187] "Women who were first married by age 18 (% of women ages 20-24)"
## [1188] "Women's share of population ages 15+ living with HIV (%)"